
Assessing heterogeneity with RATE (AUTOC & Qini)

@misc{grf,
  title        = {grf},
  author       = {Athey and Tibshirani and Wager},
  howpublished = {\url{https://grf-labs.github.io/grf/}},
  note         = {Software / documentation}
}Follow the analysis.
Select a node to explore the method
[GRF] Regression forest
Data preparation — shapes the raw inputs into what the estimator expects.
Cross-fit nuisances.
Regression forest — Honest non-parametric regression for E[Y|X], with out-of-bag predictions and pointwise CIs.
rf <- regression_forest(X, Y)
Y.hat <- predict(rf)$predictions

Before using this step, make its assumptions and its output explicit. A useful peer note explains what you would check, what could go wrong, or what would change your interpretation.
Questions to explore- Which assumption matters most here, and what evidence could challenge it?
- What would you check before passing this output to the next step?
Choose a question to start your comment.
Peer discussion
- Bring your experience, a question, or a different perspective.
Log in to comment on this step.
[GRF] Causal forest
The core estimate — where the causal quantity itself is computed.
Causal forest on the training half; produce CATE priorities.
Causal forest — Honest random forest for heterogeneous treatment effects — CATE for a binary treatment via GRF moment conditions.
cf <- causal_forest(X, Y, W)          # Y.hat, W.hat cross-fit
tau.hat <- predict(cf)$predictions    # OOB CATEs
Before using this step, make its assumptions and its output explicit. A useful peer note explains what you would check, what could go wrong, or what would change your interpretation.
Questions to explore- Which assumption matters most here, and what evidence could challenge it?
- What would you check before passing this output to the next step?
Choose a question to start your comment.
Peer discussion
- Bring your experience, a question, or a different perspective.
Log in to comment on this step.
Train / evaluation split
Data preparation — shapes the raw inputs into what the estimator expects.
Hold out an independent half to fit the evaluation forest — RATE needs out-of-sample priorities.
idx <- sample(n, n / 2)            # independent train / eval split
train <- data[idx, ]; eval <- data[-idx, ]
Before using this step, make its assumptions and its output explicit. A useful peer note explains what you would check, what could go wrong, or what would change your interpretation.
Questions to explore- Which assumption matters most here, and what evidence could challenge it?
- What would you check before passing this output to the next step?
Choose a question to start your comment.
Peer discussion
- Bring your experience, a question, or a different perspective.
Log in to comment on this step.
[GRF] Rank-weighted ATE — RATE / AUTOC / Qini
Heterogeneity — who is affected, and by how much, not just on average.
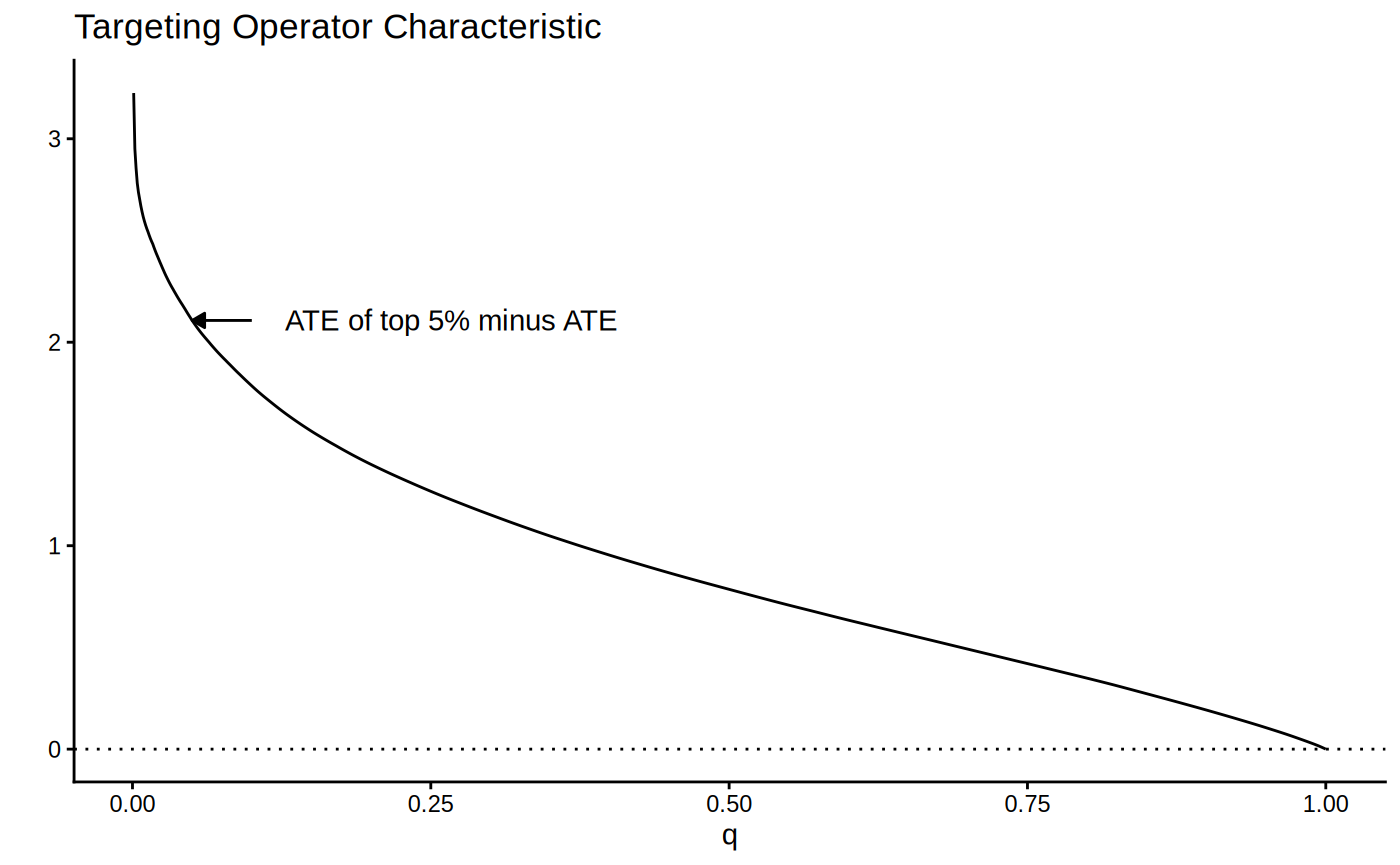
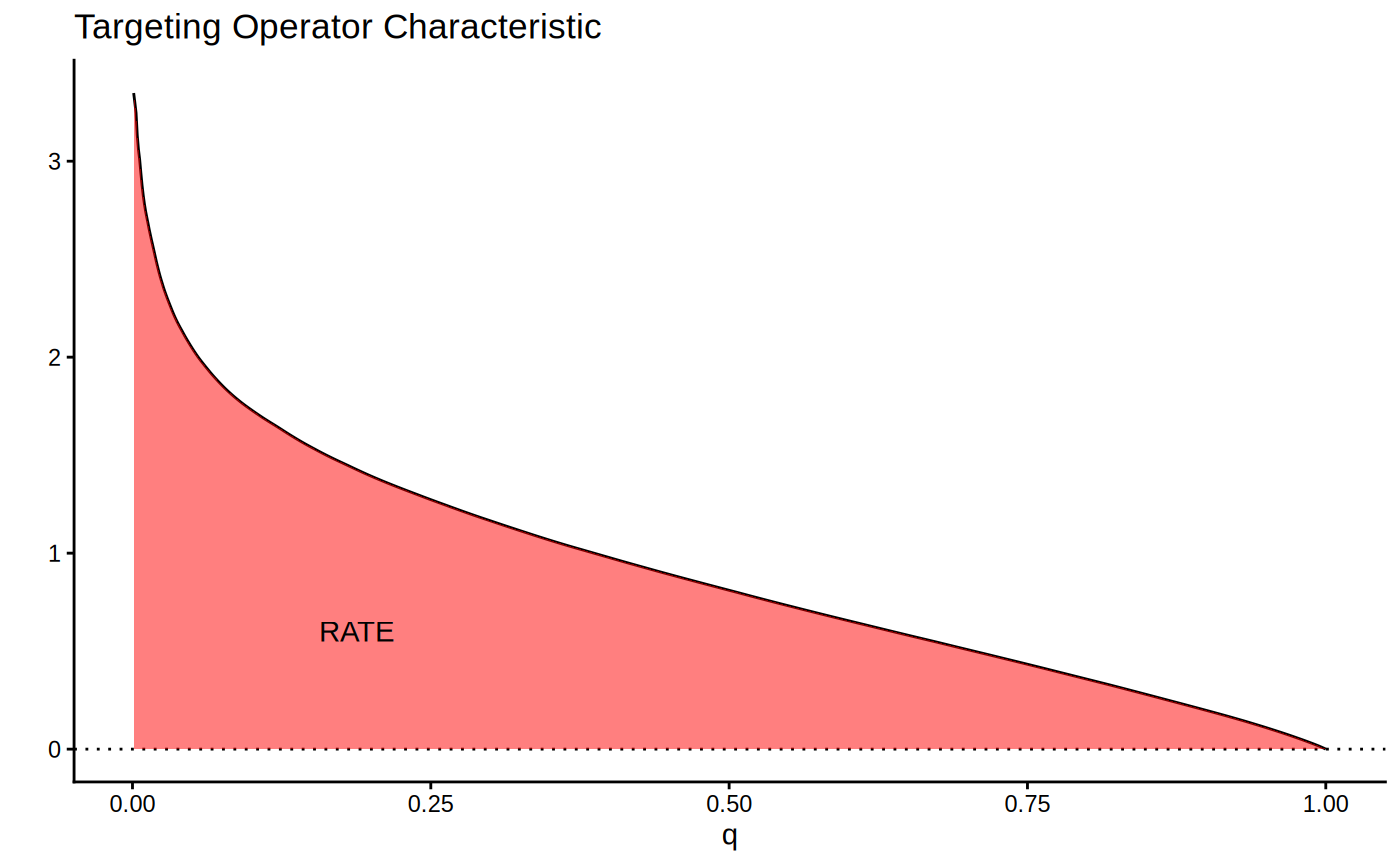
AUTOC: area under the TOC, sensitive to concentrated benefit.
Rank-weighted ATE — RATE / AUTOC / Qini — Evaluate how well a CATE estimate prioritizes treatment: TOC curve, AUTOC and Qini with confidence intervals.
rate <- rank_average_treatment_effect(eval.forest, priorities = tau.hat)
plot(rate)                          # TOC curve
rate$estimate / rate$std.err        # AUTOC z-stat
Before using this step, make its assumptions and its output explicit. A useful peer note explains what you would check, what could go wrong, or what would change your interpretation.
Questions to explore- Which assumption matters most here, and what evidence could challenge it?
- What would you check before passing this output to the next step?
Choose a question to start your comment.
Peer discussion
- Bring your experience, a question, or a different perspective.
Log in to comment on this step.
[GRF] Rank-weighted ATE — RATE / AUTOC / Qini
Heterogeneity — who is affected, and by how much, not just on average.
Qini: weights by treated fraction, sensitive to broad benefit.
Rank-weighted ATE — RATE / AUTOC / Qini — Evaluate how well a CATE estimate prioritizes treatment: TOC curve, AUTOC and Qini with confidence intervals.
rate <- rank_average_treatment_effect(eval.forest, priorities = tau.hat)
plot(rate)                          # TOC curve
rate$estimate / rate$std.err        # AUTOC z-stat
Before using this step, make its assumptions and its output explicit. A useful peer note explains what you would check, what could go wrong, or what would change your interpretation.
Questions to explore- Which assumption matters most here, and what evidence could challenge it?
- What would you check before passing this output to the next step?
Choose a question to start your comment.
Peer discussion
- Bring your experience, a question, or a different perspective.
Log in to comment on this step.
TOC plot + AUTOC/Qini table
Reporting — turn the numbers into a figure or table a reader can act on.
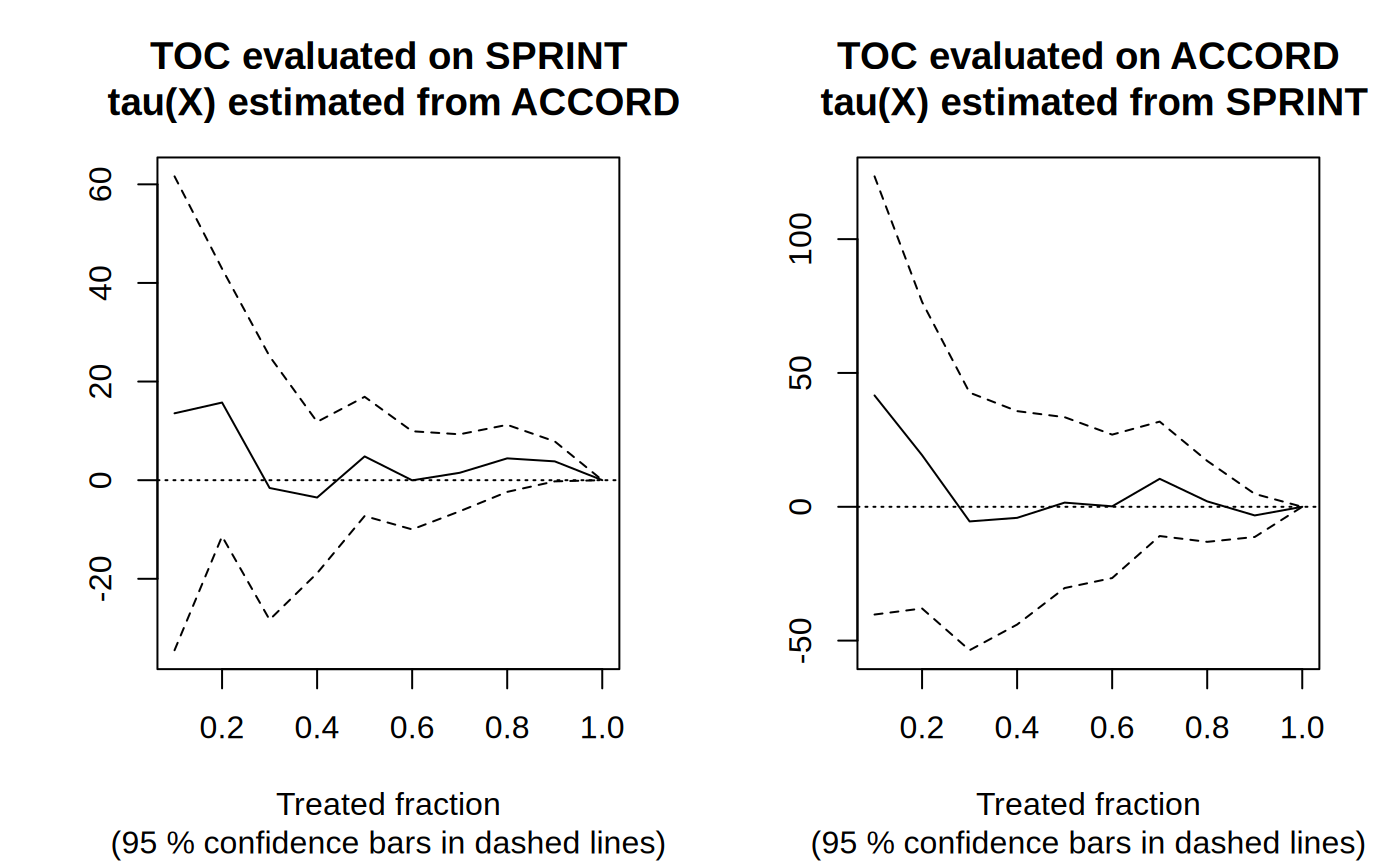
Plot the TOC with CIs; report both summaries and whether each clears zero.
Before using this step, make its assumptions and its output explicit. A useful peer note explains what you would check, what could go wrong, or what would change your interpretation.
Questions to explore- Which assumption matters most here, and what evidence could challenge it?
- What would you check before passing this output to the next step?
Choose a question to start your comment.
Peer discussion
- Bring your experience, a question, or a different perspective.
Log in to comment on this step.
Inputs & data
A fitted causal forest plus a held-out evaluation sample (X, W, Y).
Show data format & exampleHide example
Format — one row per unit. A covariate matrix X (numeric), a binary treatment W ∈ {0,1}, and an outcome Y.
  X1     X2    X3    W    Y
 0.42  -1.1   0     1   3.10
-0.07   0.6   1     0   1.85
 1.20   0.3   0     1   4.02
Figures reproduced from grf — Athey, Tibshirani & Wager — unofficial community showcase; all credit to the original authors.
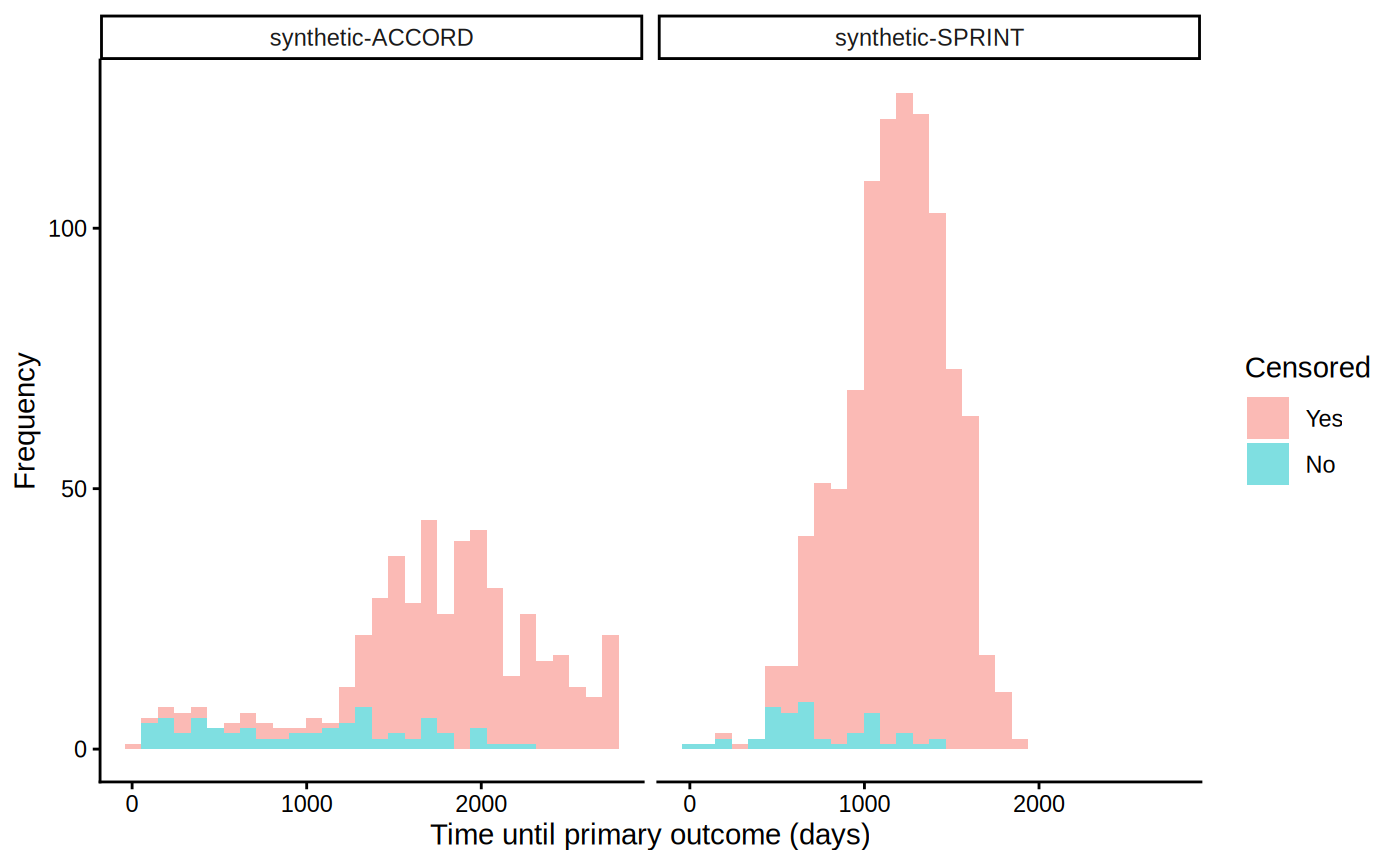
The GRF 'Assessing heterogeneity with RATE' tutorial. Fit on one half, evaluate prioritization on the other; report AUTOC (rewards concentrated heterogeneity) and Qini (rewards broad effects) with CIs. Unofficial summary.
Discuss the workflow (2)
Log in to join the discussion.
Running both AUTOC and Qini side by side is the right move — they answer different targeting questions and disagreeing is informative.
Yep. If AUTOC fires but Qini doesn't, your benefit is concentrated in a small group.
The independent train/eval split is non-negotiable here. Priorities have to be out-of-sample or RATE is optimistic.