
Bayesian regression discontinuity with credible intervals (CausalPy)

@misc{causalpy,
  title        = {CausalPy},
  author       = {PyMC Labs},
  howpublished = {\url{https://causalpy.readthedocs.io/}},
  note         = {Software / documentation}
}Follow the analysis.
Select a node to explore the method
Running variable, threshold, outcome
Data preparation — shapes the raw inputs into what the estimator expects.
Treatment switches on at the cutoff c. Identification rests on continuity of everything else at c.
import causalpy as cp
# x running variable, cutoff c, treated = (x >= c)

Before using this step, make its assumptions and its output explicit. A useful peer note explains what you would check, what could go wrong, or what would change your interpretation.
Questions to explore- Which assumption matters most here, and what evidence could challenge it?
- What would you check before passing this output to the next step?
Choose a question to start your comment.
Peer discussion
- Bring your experience, a question, or a different perspective.
Log in to comment on this step.
A Bayesian model each side of the cutoff
The core estimate — where the causal quantity itself is computed.
Fit a flexible trend with a treatment indicator; the coefficient on the indicator is the discontinuity, with a prior and full posterior.
result = cp.pymc_experiments.RegressionDiscontinuity(
    df, formula='y ~ 1 + x + treated',
    running_variable_name='x', treatment_threshold=0.5)
Before using this step, make its assumptions and its output explicit. A useful peer note explains what you would check, what could go wrong, or what would change your interpretation.
Questions to explore- Which assumption matters most here, and what evidence could challenge it?
- What would you check before passing this output to the next step?
Choose a question to start your comment.
Peer discussion
- Bring your experience, a question, or a different perspective.
Log in to comment on this step.
Posterior & 94% credible interval for the jump
Uncertainty quantification — standard errors, intervals, and aggregation.
Instead of a single number ± SE, you get the whole posterior of the discontinuity — summarised as a credible interval.
result.summary()   # discontinuity, CI_94%
result.plot()
Before using this step, make its assumptions and its output explicit. A useful peer note explains what you would check, what could go wrong, or what would change your interpretation.
Questions to explore- Which assumption matters most here, and what evidence could challenge it?
- What would you check before passing this output to the next step?
Choose a question to start your comment.
Peer discussion
- Bring your experience, a question, or a different perspective.
Log in to comment on this step.
Bandwidth & functional-form sensitivity
A robustness check — does the headline result survive a different lens?
Refit on a narrow window and with different trends; a discontinuity that survives is one you can defend.
cp.pymc_experiments.RegressionDiscontinuity(
    df, ..., epsilon=0.2)   # restrict near the cutoff
Before using this step, make its assumptions and its output explicit. A useful peer note explains what you would check, what could go wrong, or what would change your interpretation.
Questions to explore- Which assumption matters most here, and what evidence could challenge it?
- What would you check before passing this output to the next step?
Choose a question to start your comment.
Peer discussion
- Bring your experience, a question, or a different perspective.
Log in to comment on this step.
Inputs & data
A running variable with a known threshold, a binary treatment that switches on at the cutoff, and an outcome.
Show data format & exampleHide example
Format — x (running variable), y (outcome), treatment = 1{x ≥ cutoff}.
import causalpy as cp
result = cp.pymc_experiments.RegressionDiscontinuity(
    df, formula='y ~ 1 + x + treated', running_variable_name='x',
    treatment_threshold=0.5)
result.plot()
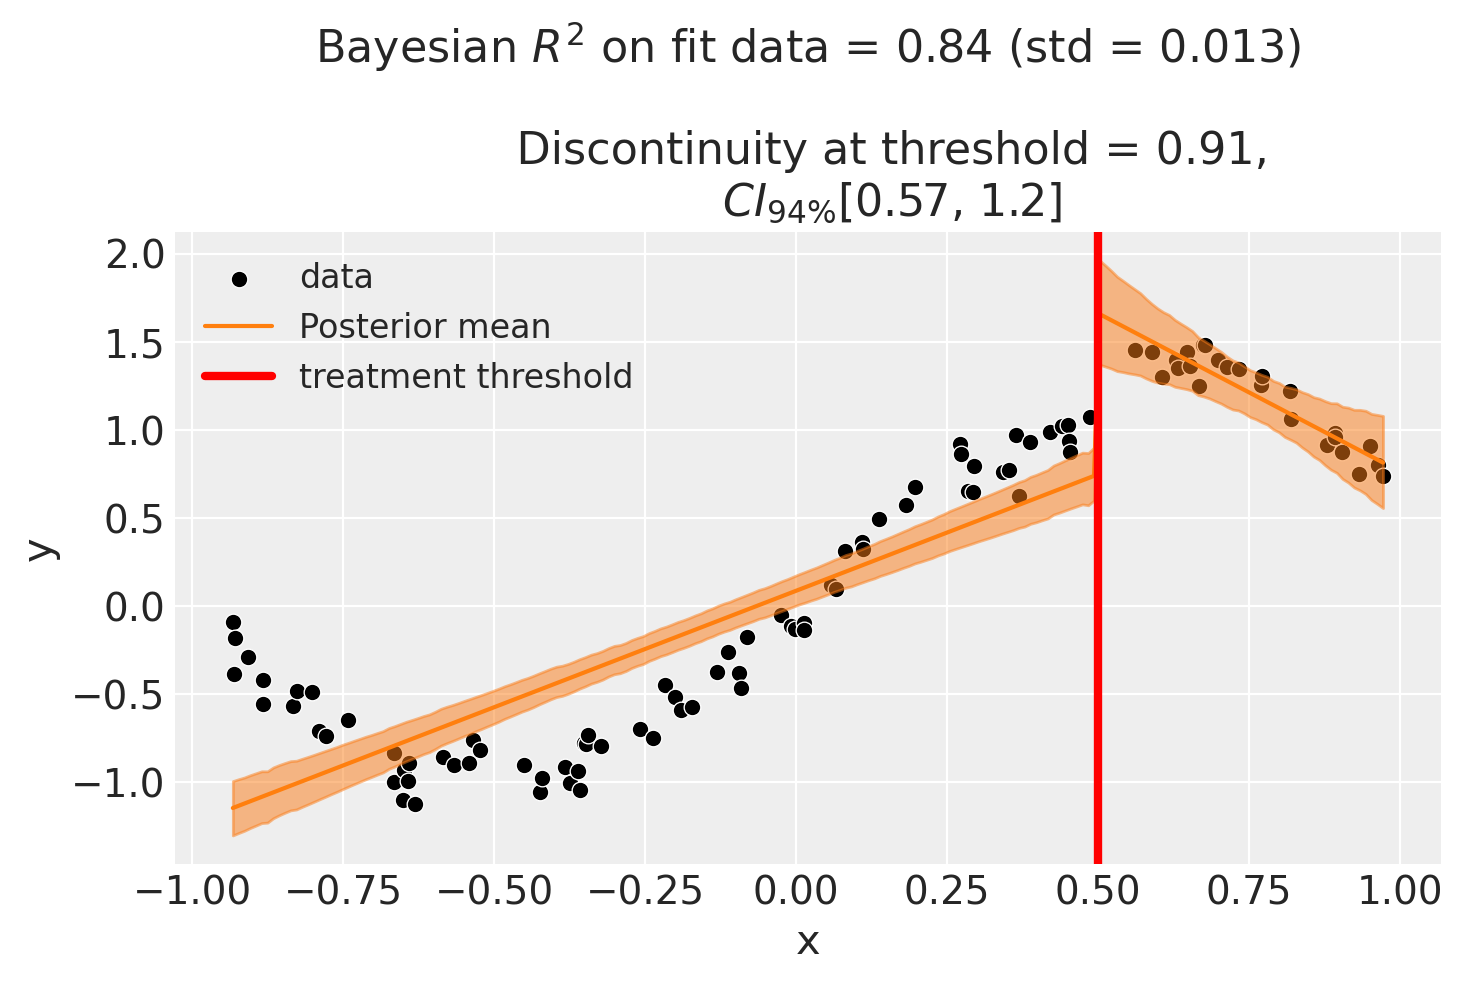
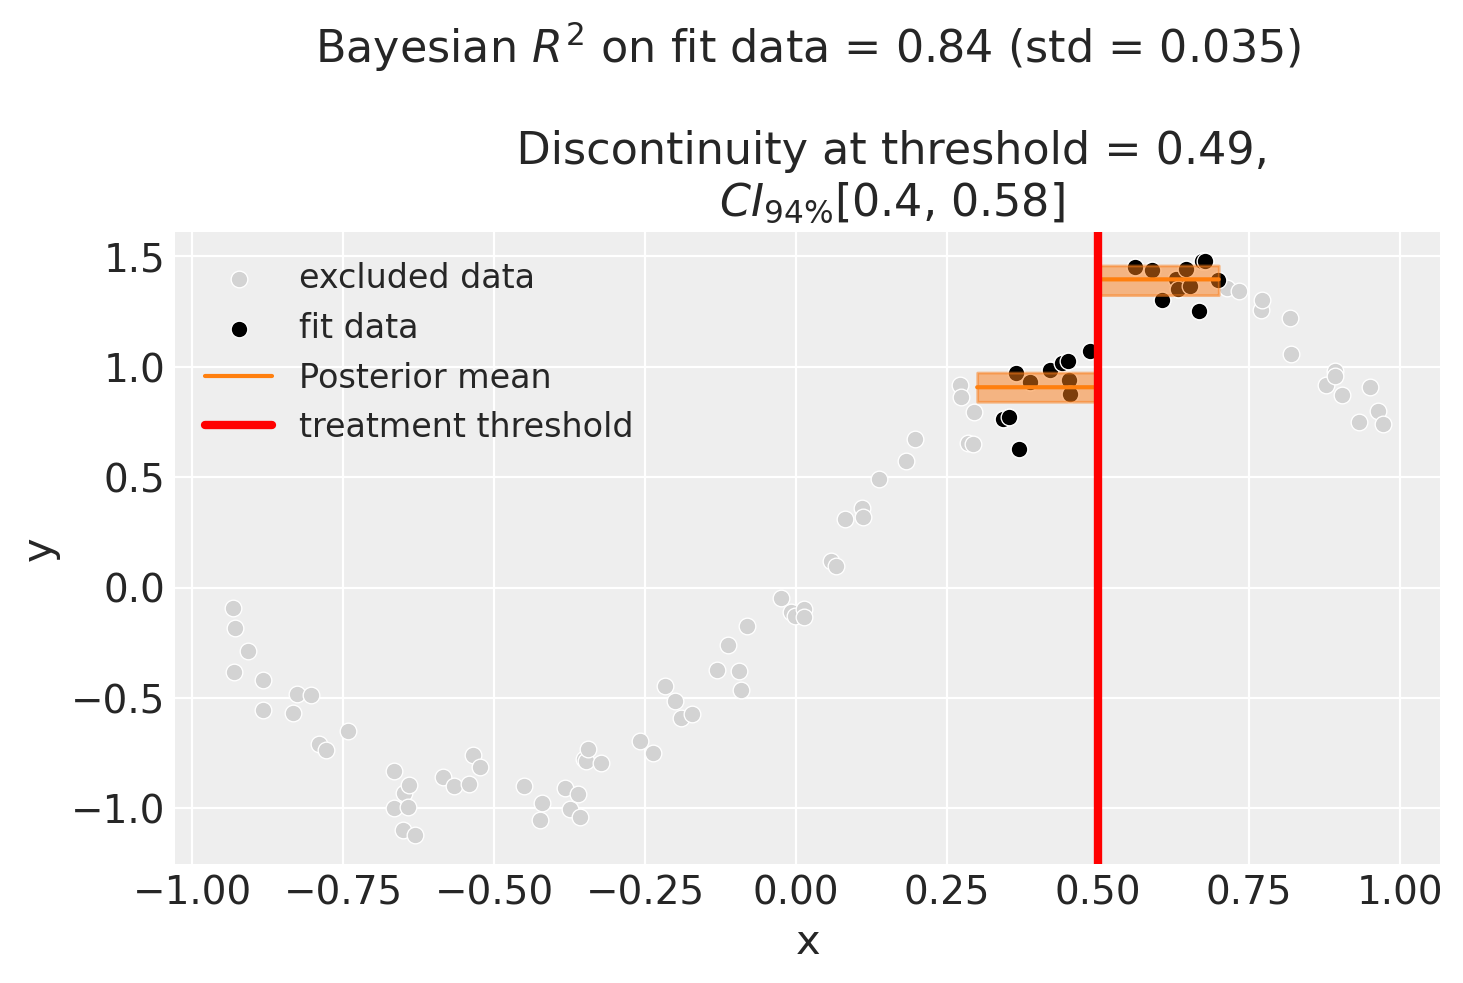
Figures reproduced from CausalPy — PyMC Labs — unofficial community showcase; all credit to the original authors.
⚠️ Unofficial community showcase of causalpy. Not affiliated with the authors; all credit to them.
Fit a model on each side of the cutoff, put a posterior on the jump, and report a credible interval for the discontinuity — plus an honest look at how it moves with the bandwidth.
Discuss the workflow (2)
Log in to join the discussion.
A full posterior on the discontinuity beats a point estimate ± SE for communicating uncertainty to non-stats stakeholders.
Nice that the bandwidth refit is built in as a robustness step. The estimate moving with the window is the whole RD ballgame.
Exactly — I always show the narrow-window and full-sample fits next to each other so nobody thinks the number is bandwidth-free.