
Causal forest with time-to-event data (survival)

@misc{grf,
  title        = {grf},
  author       = {Athey and Tibshirani and Wager},
  howpublished = {\url{https://grf-labs.github.io/grf/}},
  note         = {Software / documentation}
}Follow the analysis.
Select a node to explore the method
[GRF] Survival forest
A pre-flight check — run this before trusting any estimate downstream.
Inspect the conditional censoring/survival curves; pick a horizon h with enough events.
Survival forest — Non-parametric conditional survival function S(t | X) under right-censoring.
sf <- survival_forest(X, Y, D)
predict(sf)$predictions             # conditional survival curve

Before using this step, make its assumptions and its output explicit. A useful peer note explains what you would check, what could go wrong, or what would change your interpretation.
Questions to explore- Which assumption matters most here, and what evidence could challenge it?
- What would you check before passing this output to the next step?
Choose a question to start your comment.
Peer discussion
- Bring your experience, a question, or a different perspective.
Log in to comment on this step.
[GRF] Causal survival forest
The core estimate — where the causal quantity itself is computed.
Estimate τ(x) as the difference in restricted mean survival time up to h.
Causal survival forest — CATE with right-censored, time-to-event outcomes (RMST or survival probability).
csf <- causal_survival_forest(X, Y, W, D, horizon = h)
predict(csf)$predictions            # CATE on the RMST scale
Before using this step, make its assumptions and its output explicit. A useful peer note explains what you would check, what could go wrong, or what would change your interpretation.
Questions to explore- Which assumption matters most here, and what evidence could challenge it?
- What would you check before passing this output to the next step?
Choose a question to start your comment.
Peer discussion
- Bring your experience, a question, or a different perspective.
Log in to comment on this step.
[GRF] AIPW average treatment effect
Uncertainty quantification — standard errors, intervals, and aggregation.
Aggregate to a doubly-robust RMST-difference ATE.
AIPW average treatment effect — Doubly-robust ATE / ATT / ATC / overlap-weighted effect from a trained causal forest, via augmented IPW.
average_treatment_effect(cf, target.sample = "all")      # ATE
average_treatment_effect(cf, target.sample = "treated")  # ATT
Before using this step, make its assumptions and its output explicit. A useful peer note explains what you would check, what could go wrong, or what would change your interpretation.
Questions to explore- Which assumption matters most here, and what evidence could challenge it?
- What would you check before passing this output to the next step?
Choose a question to start your comment.
Peer discussion
- Bring your experience, a question, or a different perspective.
Log in to comment on this step.
test_calibration()
A pre-flight check — run this before trusting any estimate downstream.
Check the forest is calibrated on the RMST scale.
test_calibration(cf) # mean & differential forest coefficients ≈ 1?
Before using this step, make its assumptions and its output explicit. A useful peer note explains what you would check, what could go wrong, or what would change your interpretation.
Questions to explore- Which assumption matters most here, and what evidence could challenge it?
- What would you check before passing this output to the next step?
Choose a question to start your comment.
Peer discussion
- Bring your experience, a question, or a different perspective.
Log in to comment on this step.
RMST difference by subgroup
Reporting — turn the numbers into a figure or table a reader can act on.
Report the survival benefit overall and for key subgroups, with the censoring caveat.
Before using this step, make its assumptions and its output explicit. A useful peer note explains what you would check, what could go wrong, or what would change your interpretation.
Questions to explore- Which assumption matters most here, and what evidence could challenge it?
- What would you check before passing this output to the next step?
Choose a question to start your comment.
Peer discussion
- Bring your experience, a question, or a different perspective.
Log in to comment on this step.
Inputs & data
Right-censored survival time Y, event indicator D, treatment W, covariates X.
Show data format & exampleHide example
Format — one row per unit. Covariates X, binary treatment W, a (possibly censored) time Y, and an event indicator D (1 = event, 0 = censored).
  X1    X2   W     Y     D
 0.4  -1.1  1   12.3   1
-0.1   0.6  0   30.0   0   # censored
 1.2   0.3  1    8.7   1
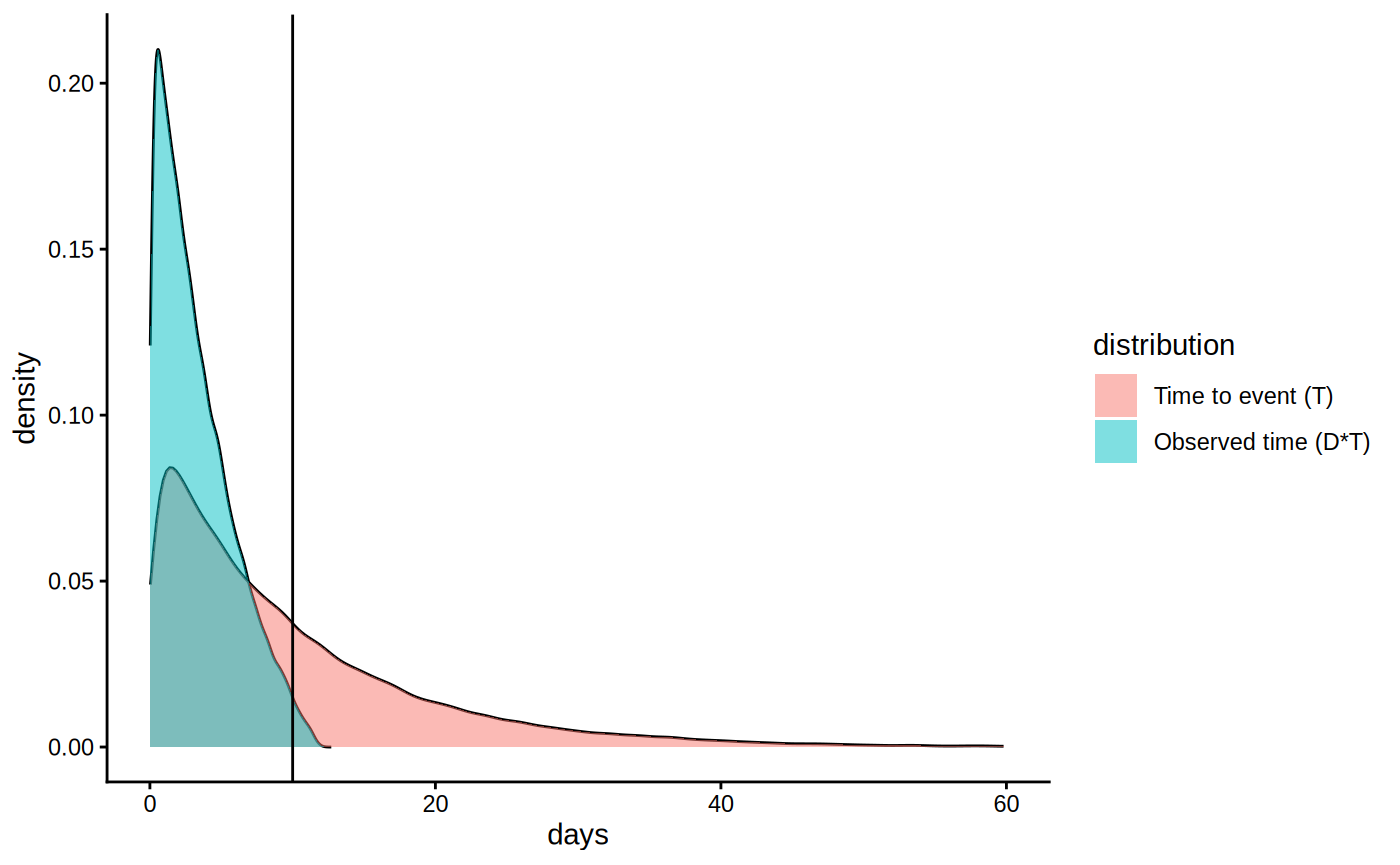
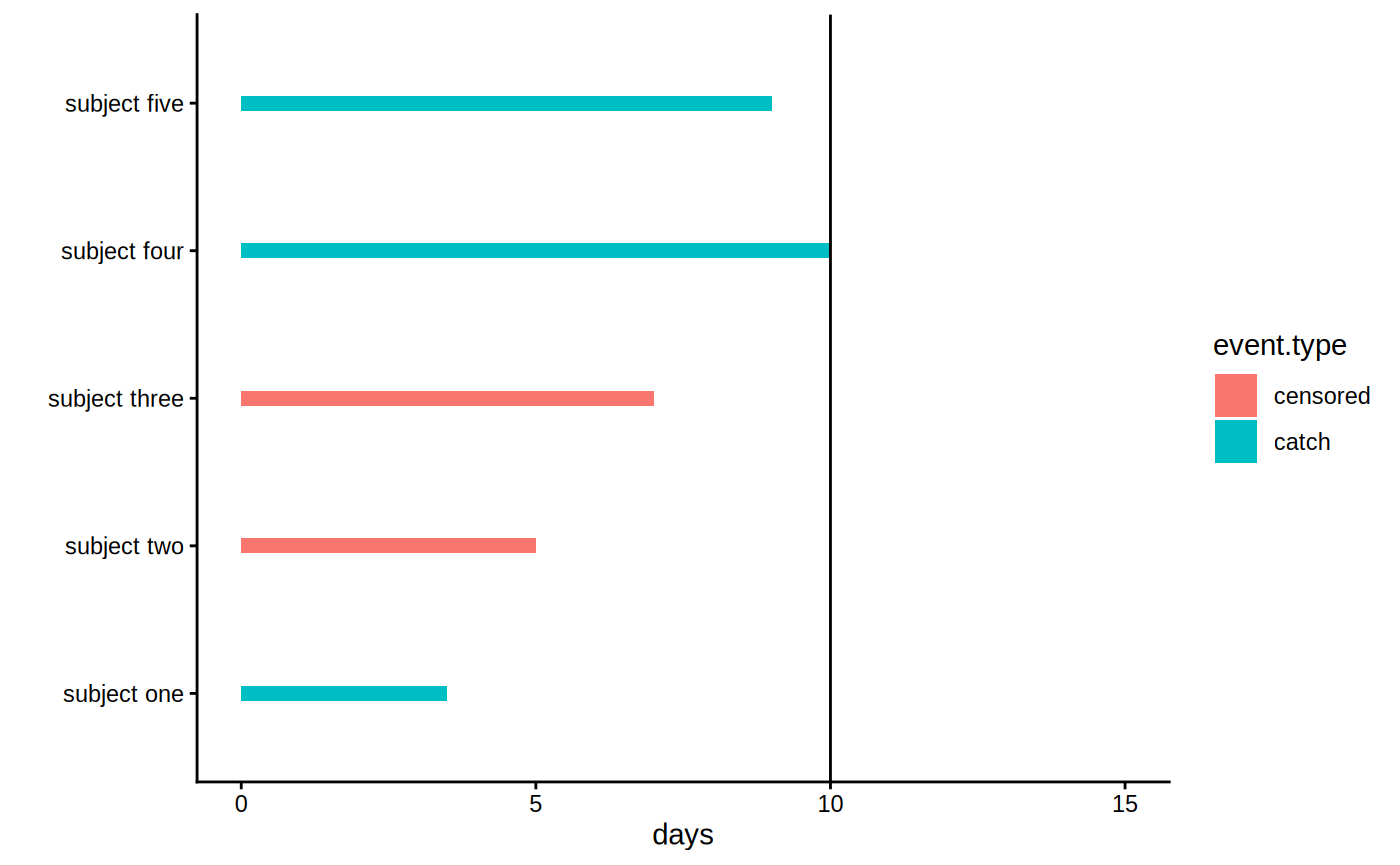
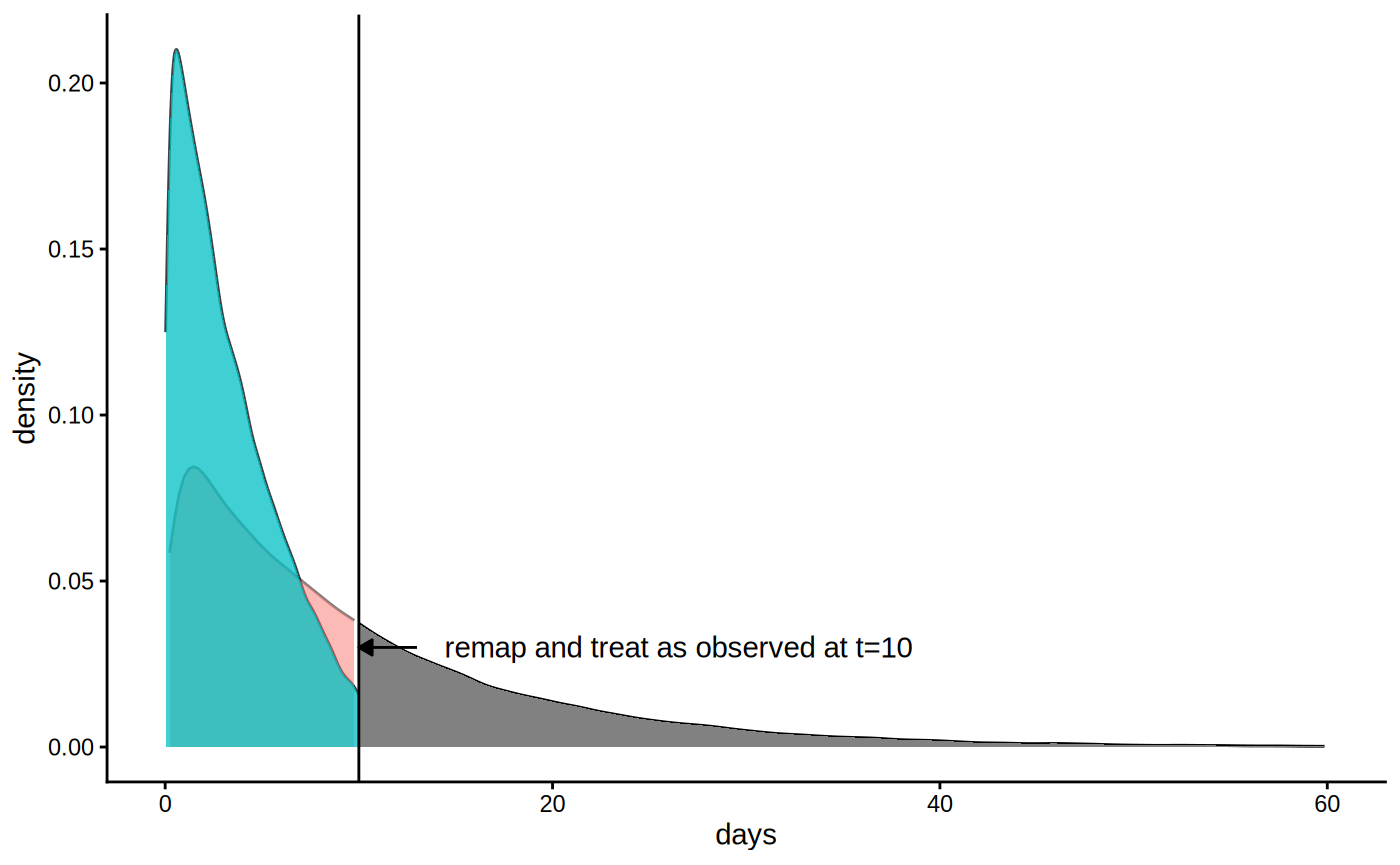
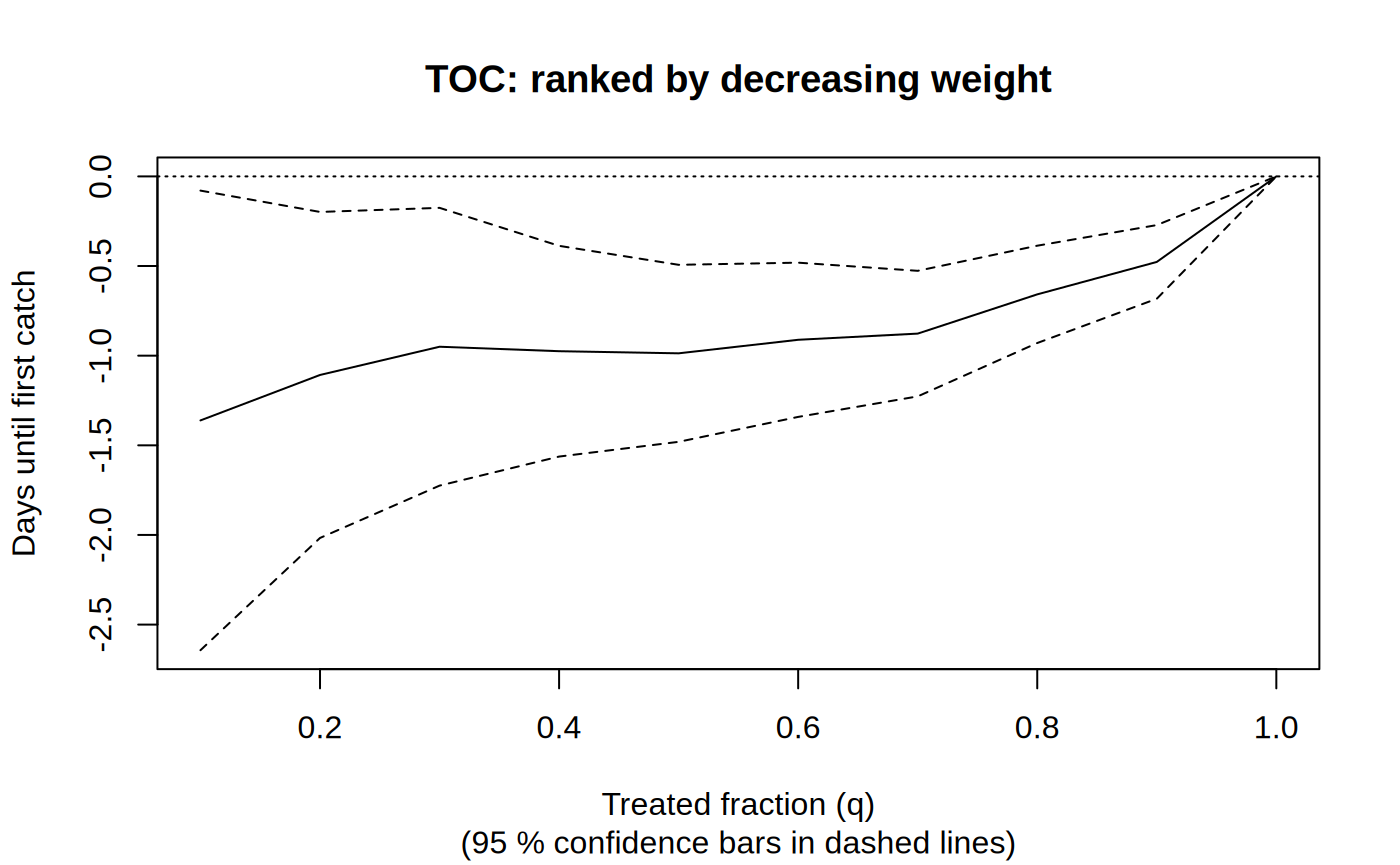
Figures reproduced from grf — Athey, Tibshirani & Wager — unofficial community showcase; all credit to the original authors.
The GRF survival tutorial. Model censoring first, estimate CATE on the RMST scale, then aggregate and validate. Unofficial summary.
Discuss the workflow (2)
Log in to join the discussion.
Modelling censoring as step 1 instead of an afterthought is exactly right. So many survival analyses get this backwards.
The horizon-sensitivity caveat in the report step is a nice touch. RMST is horizon-dependent and people forget.