
Difference-in-differences with multiple periods (did)

@misc{did,
  title        = {did},
  author       = {Callaway and Sant'Anna},
  howpublished = {\url{https://bcallaway11.github.io/did/}},
  note         = {Software / documentation}
}Follow the analysis.
Select a node to explore the method
Build the staggered panel
Data preparation — shapes the raw inputs into what the estimator expects.
One row per (unit, period); never-treated units get group 0 / Inf.
# id · period · first.treat (group) · Y
head(panel)

Before using this step, make its assumptions and its output explicit. A useful peer note explains what you would check, what could go wrong, or what would change your interpretation.
Questions to explore- Which assumption matters most here, and what evidence could challenge it?
- What would you check before passing this output to the next step?
Choose a question to start your comment.
Peer discussion
- Bring your experience, a question, or a different perspective.
Log in to comment on this step.
[did] Group-time ATT — att_gt()
The core estimate — where the causal quantity itself is computed.
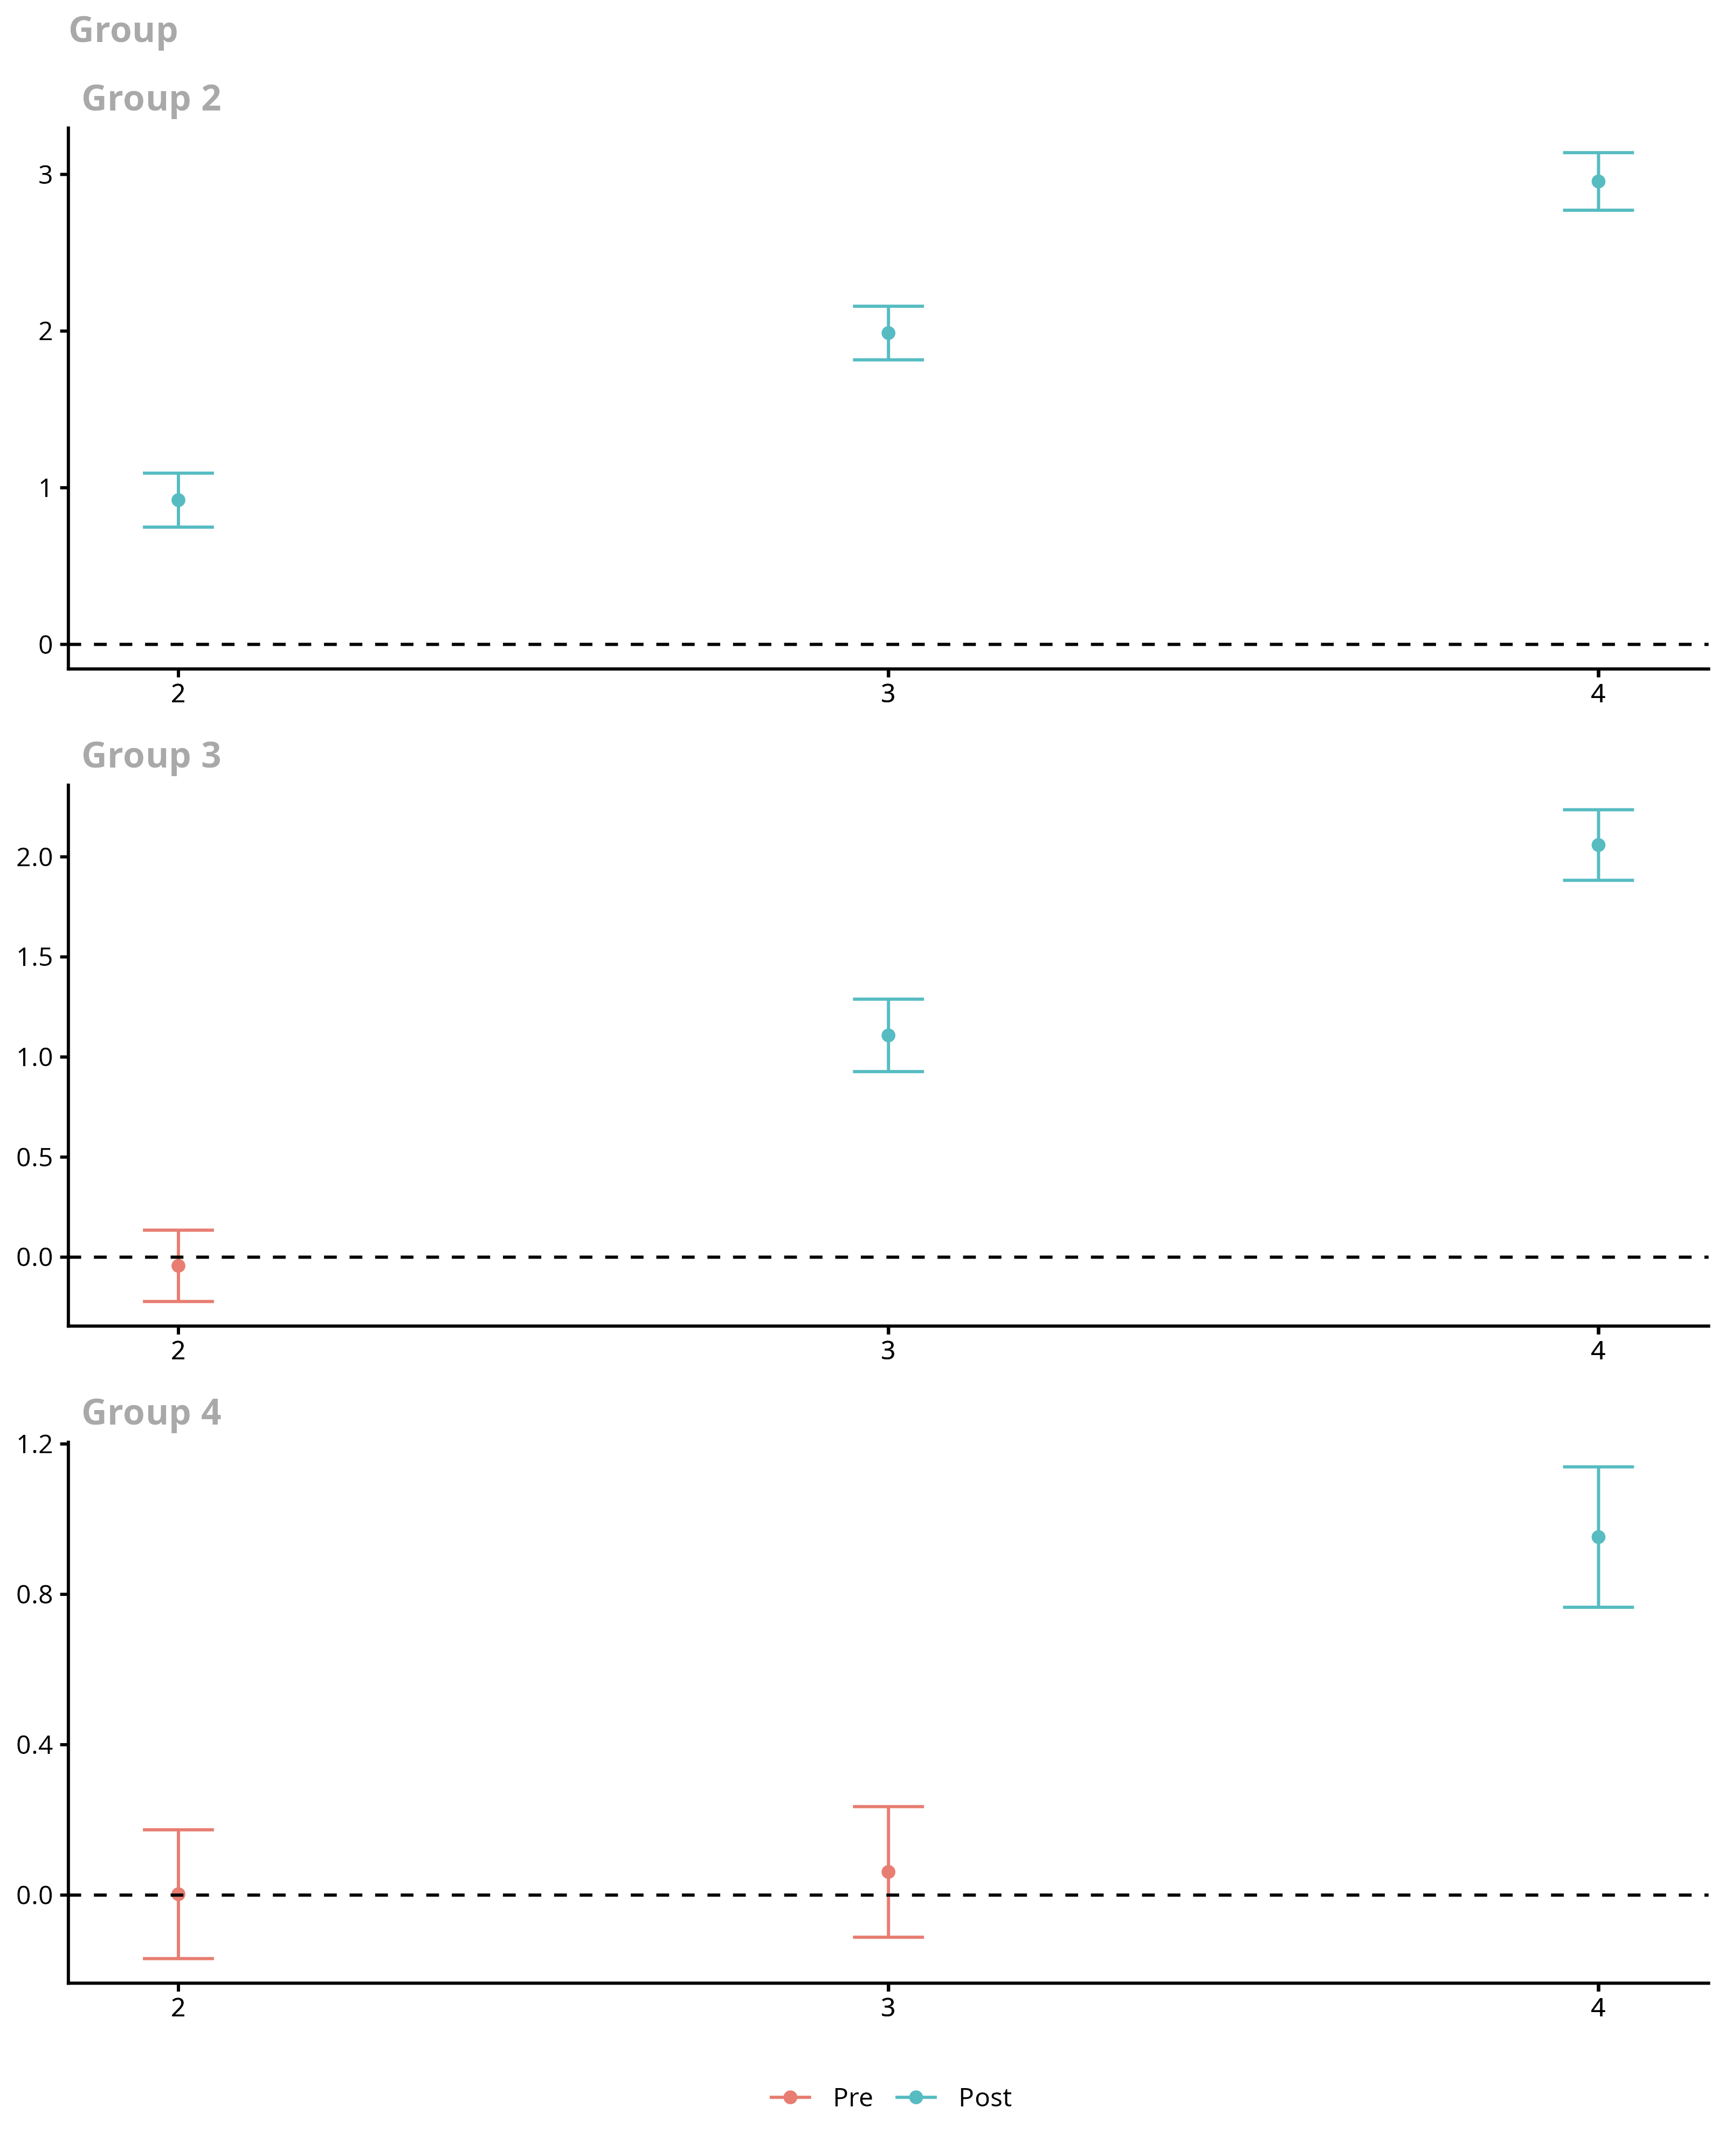
Estimate ATT(g,t) for every cohort and period against not-yet-treated controls.
Group-time ATT — att_gt() — Difference-in-differences with multiple periods and staggered adoption: ATT(g,t) with clean (not-yet-treated) controls.
att <- att_gt("Y", "period", "id", "first.treat", data = panel)
Before using this step, make its assumptions and its output explicit. A useful peer note explains what you would check, what could go wrong, or what would change your interpretation.
Questions to explore- Which assumption matters most here, and what evidence could challenge it?
- What would you check before passing this output to the next step?
Choose a question to start your comment.
Peer discussion
- Bring your experience, a question, or a different perspective.
Log in to comment on this step.
aggte(type = 'dynamic')
Uncertainty quantification — standard errors, intervals, and aggregation.
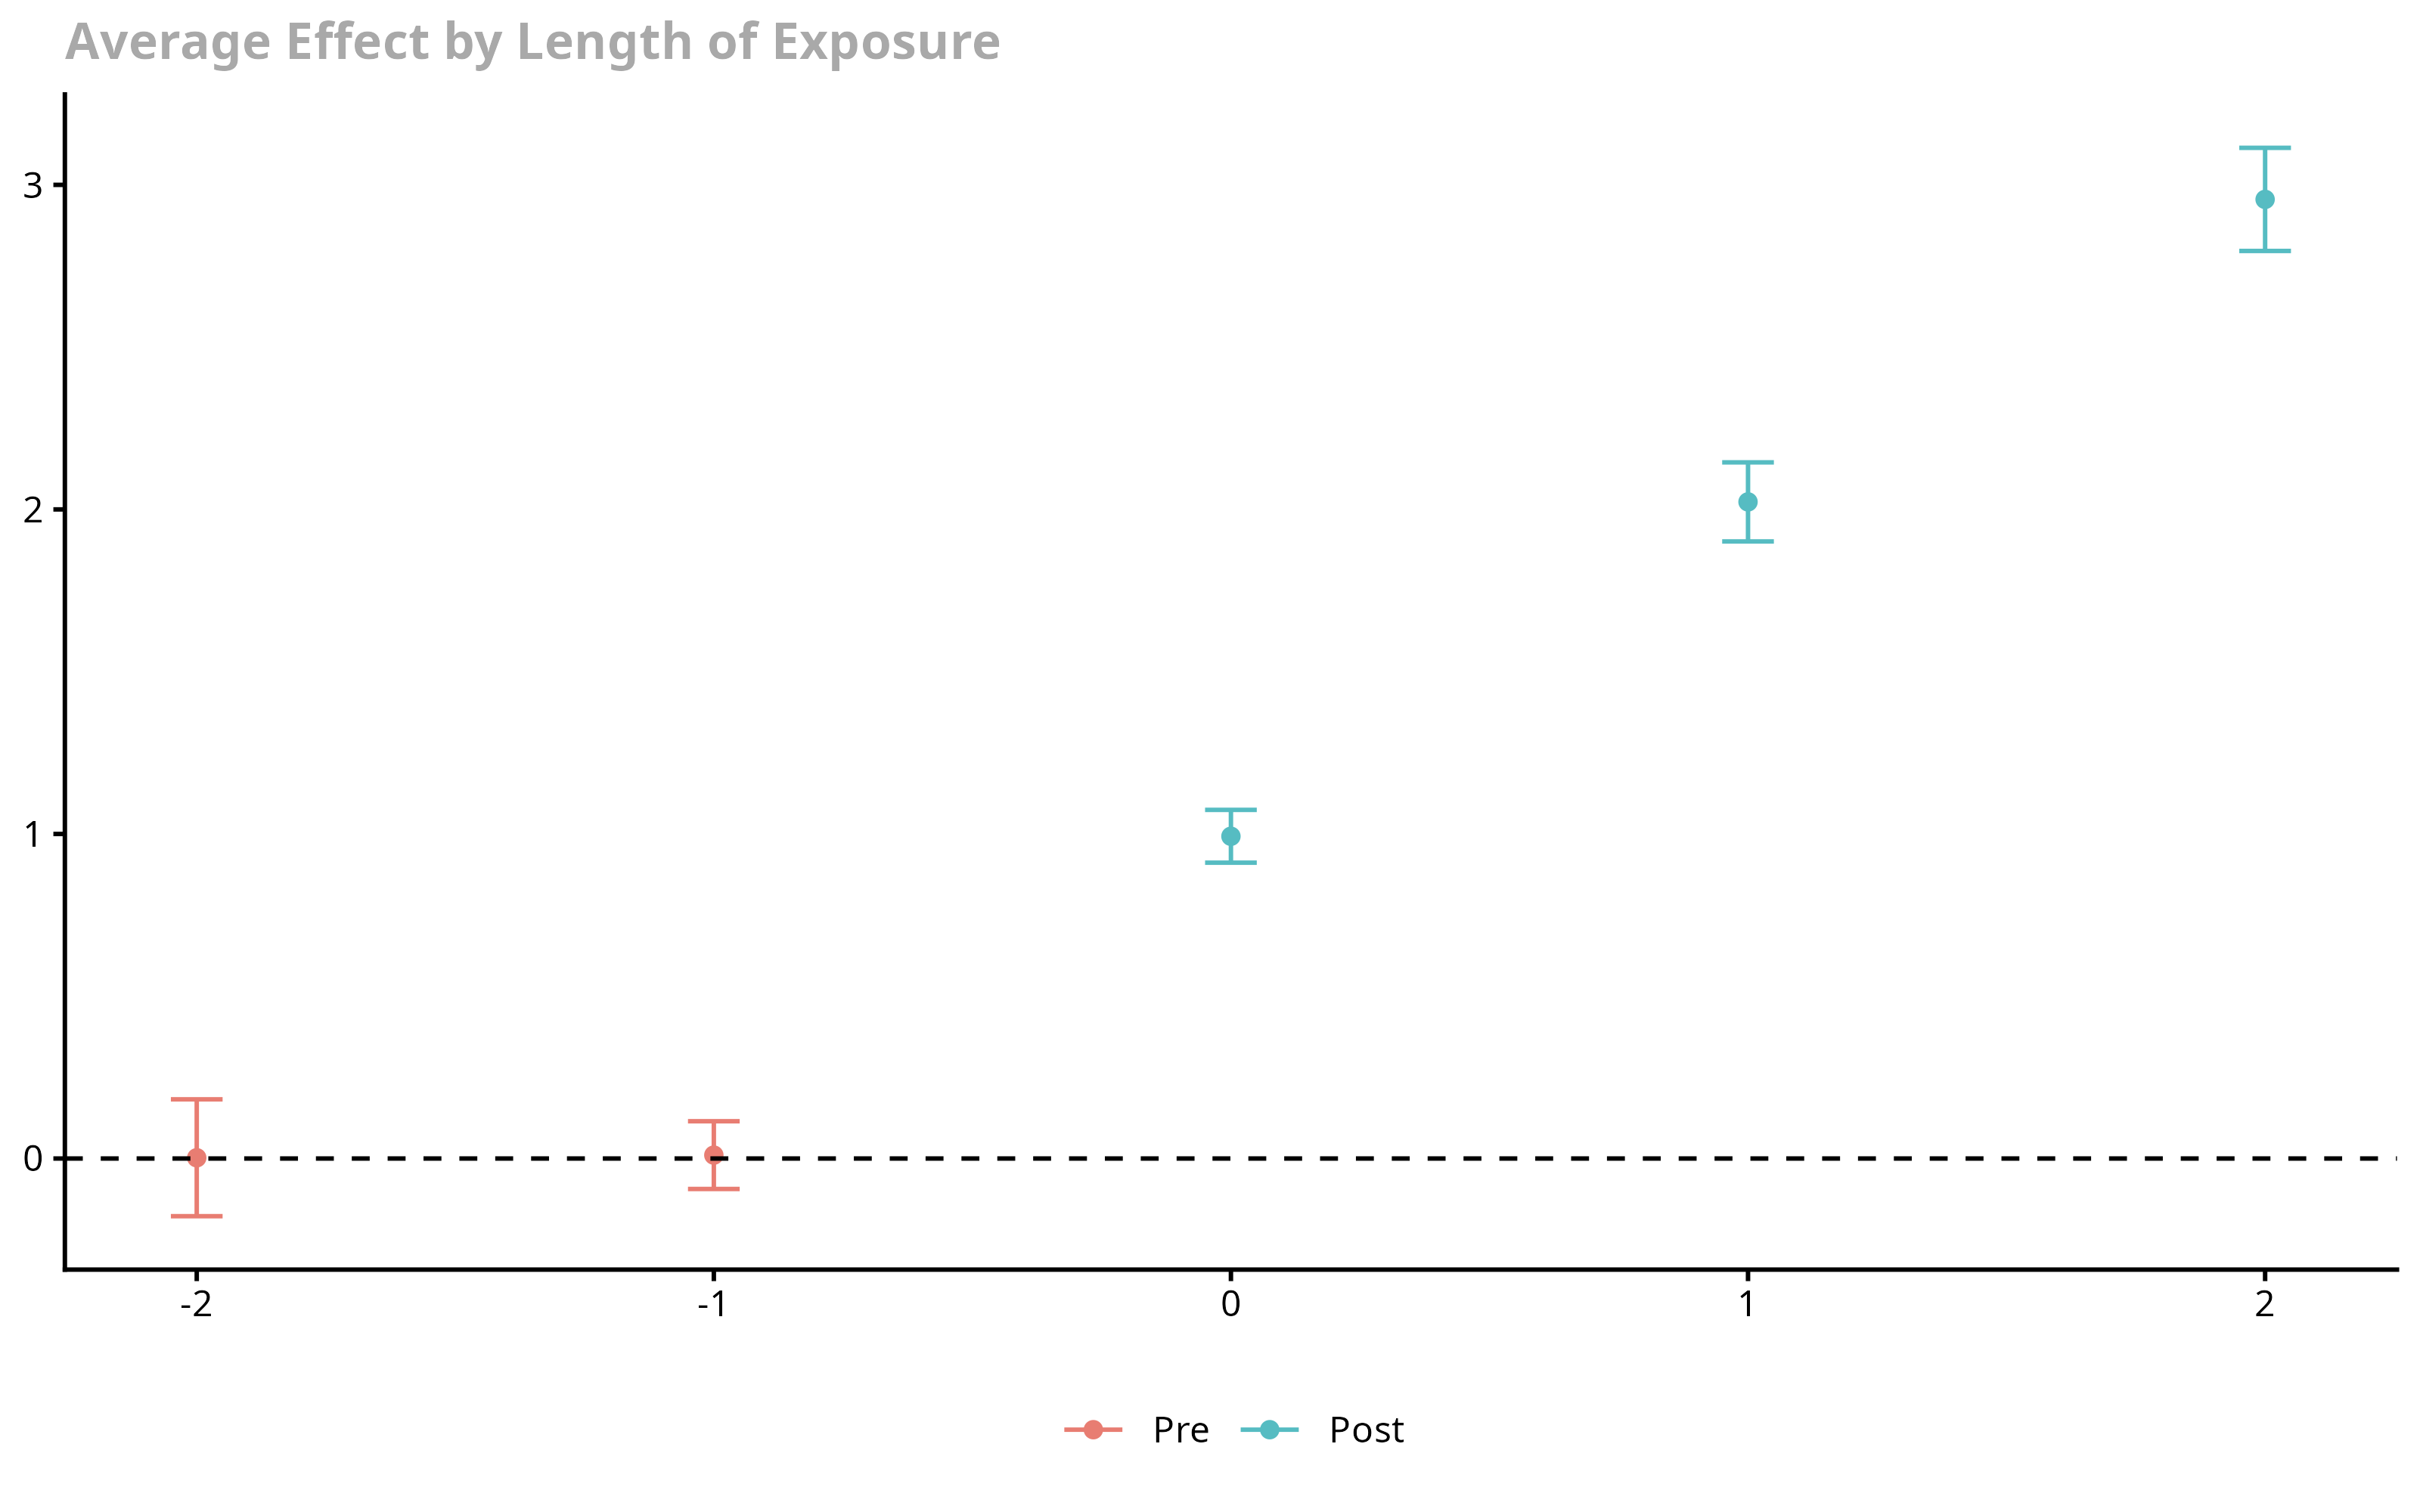
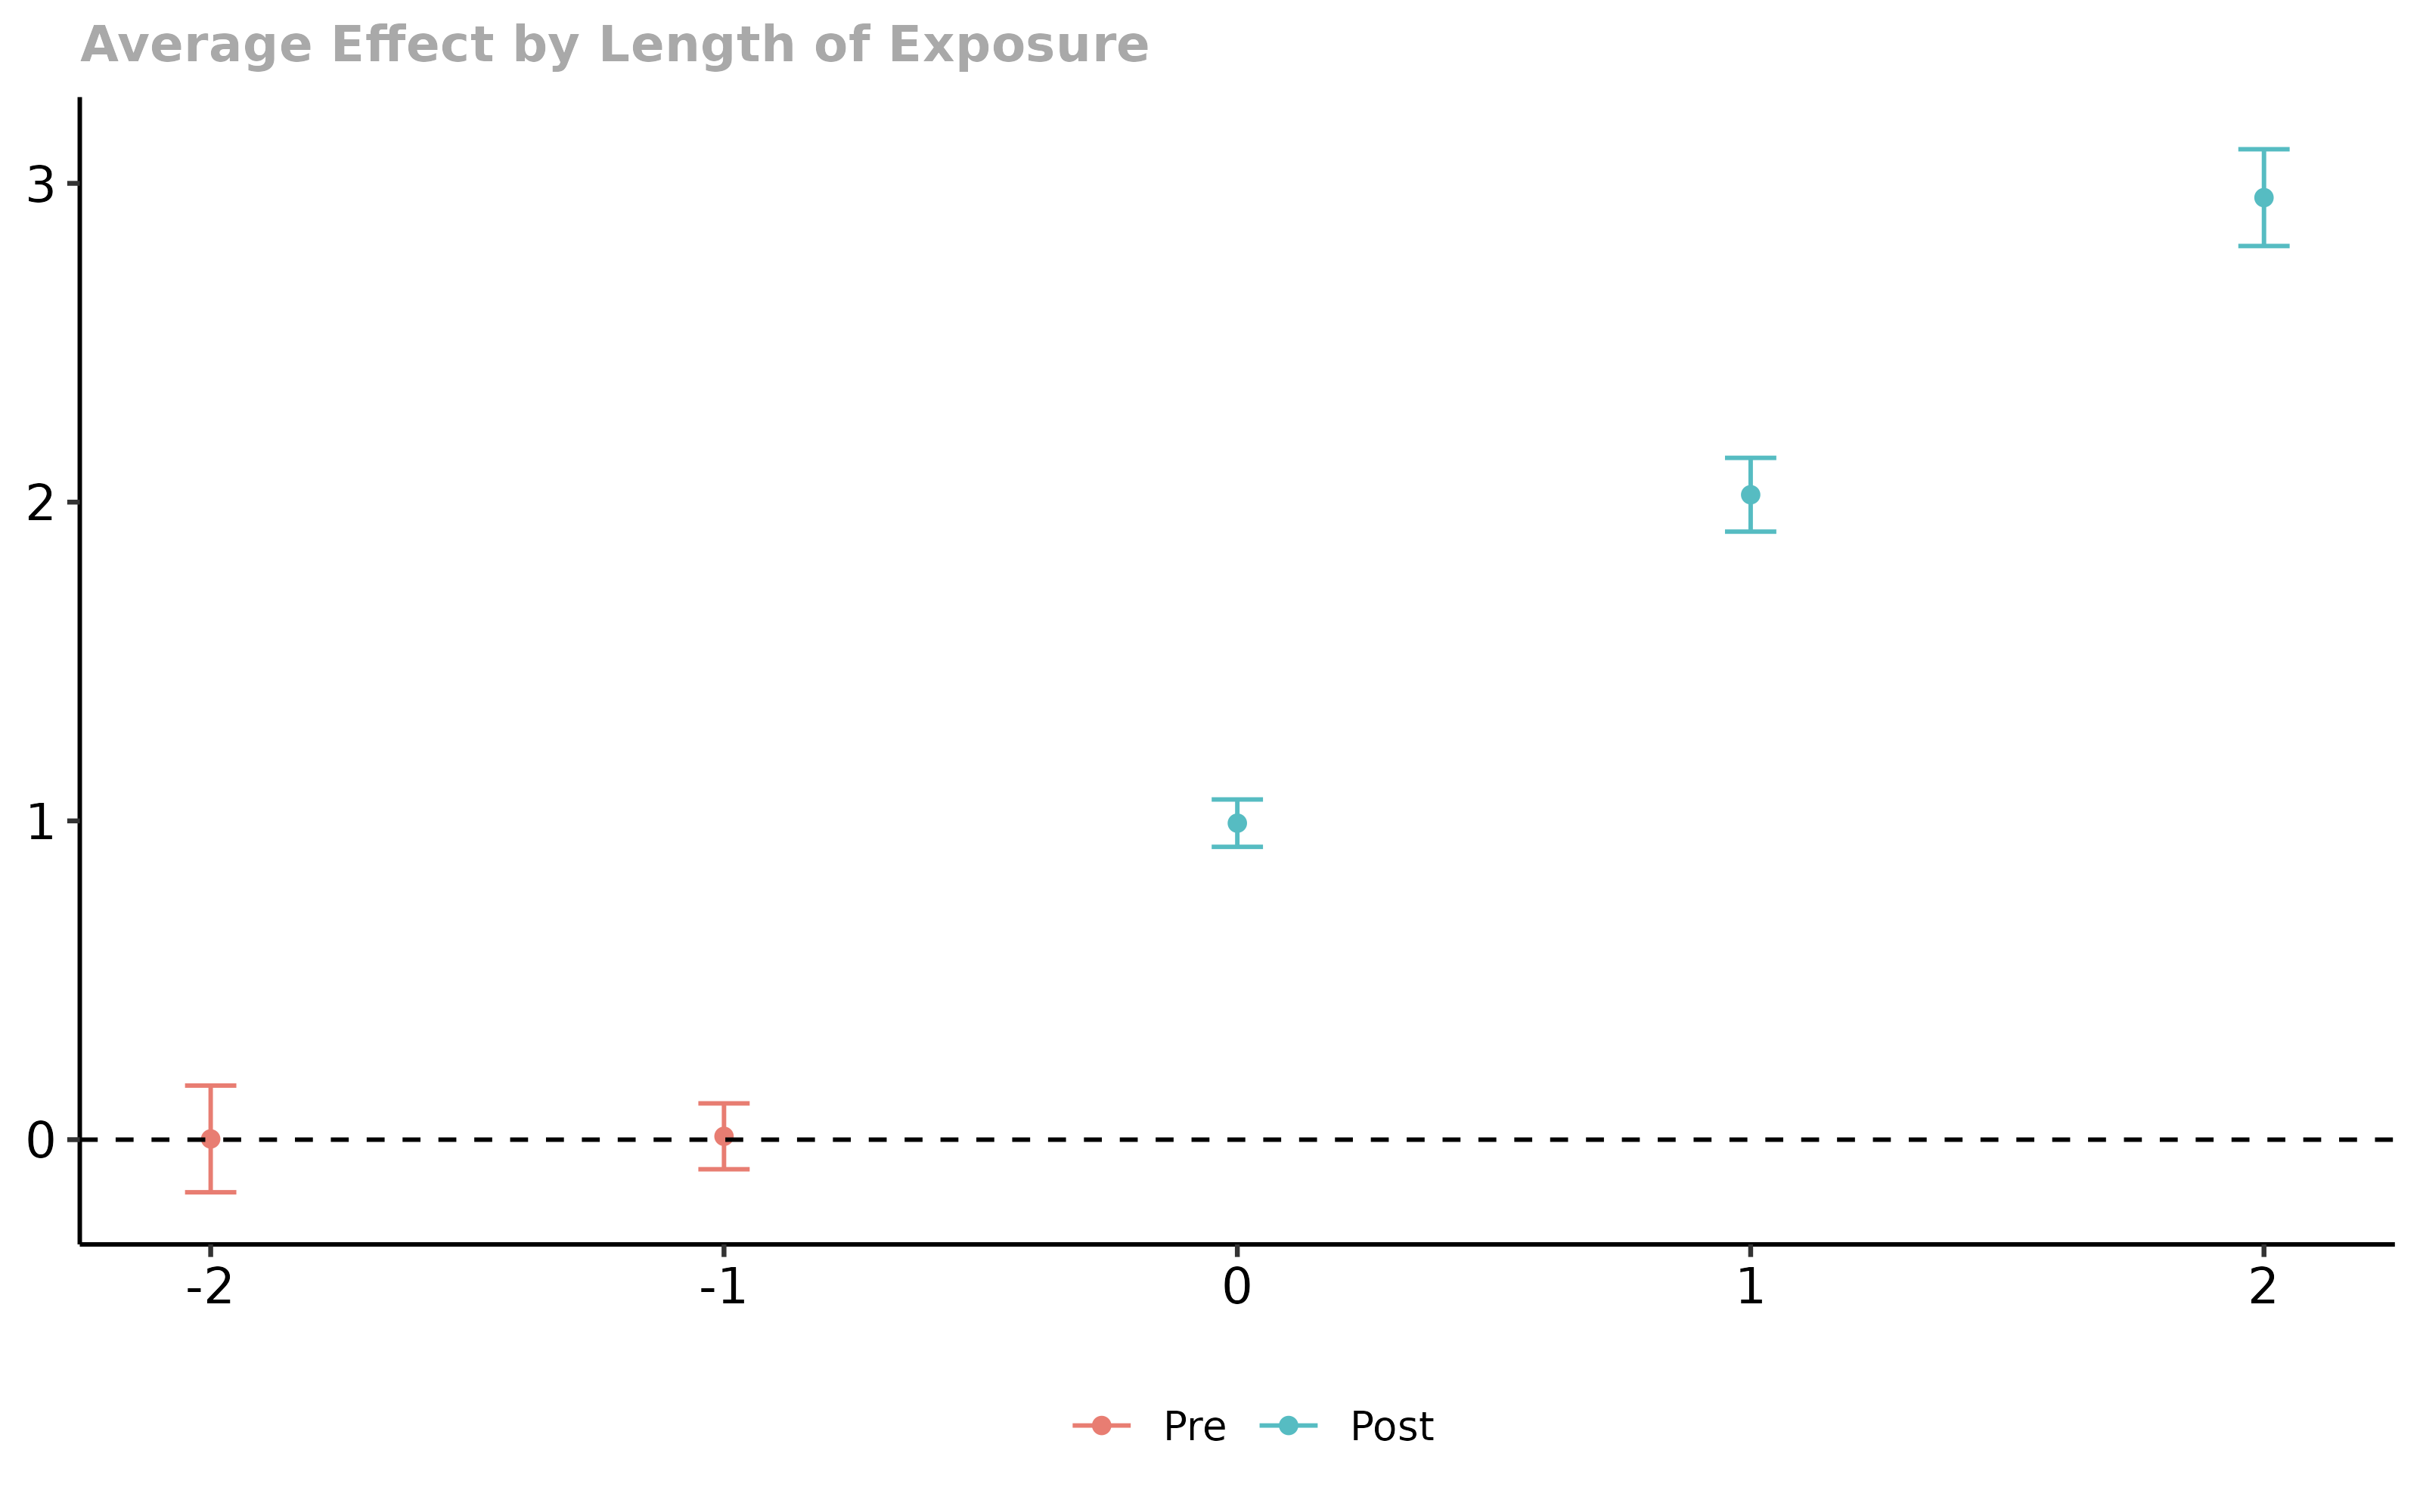
Aggregate to an event study — effect by length of exposure; pre-periods test parallel trends.
es <- aggte(att, type = "dynamic")
Before using this step, make its assumptions and its output explicit. A useful peer note explains what you would check, what could go wrong, or what would change your interpretation.
Questions to explore- Which assumption matters most here, and what evidence could challenge it?
- What would you check before passing this output to the next step?
Choose a question to start your comment.
Peer discussion
- Bring your experience, a question, or a different perspective.
Log in to comment on this step.
aggte(type = 'group')
Heterogeneity — who is affected, and by how much, not just on average.
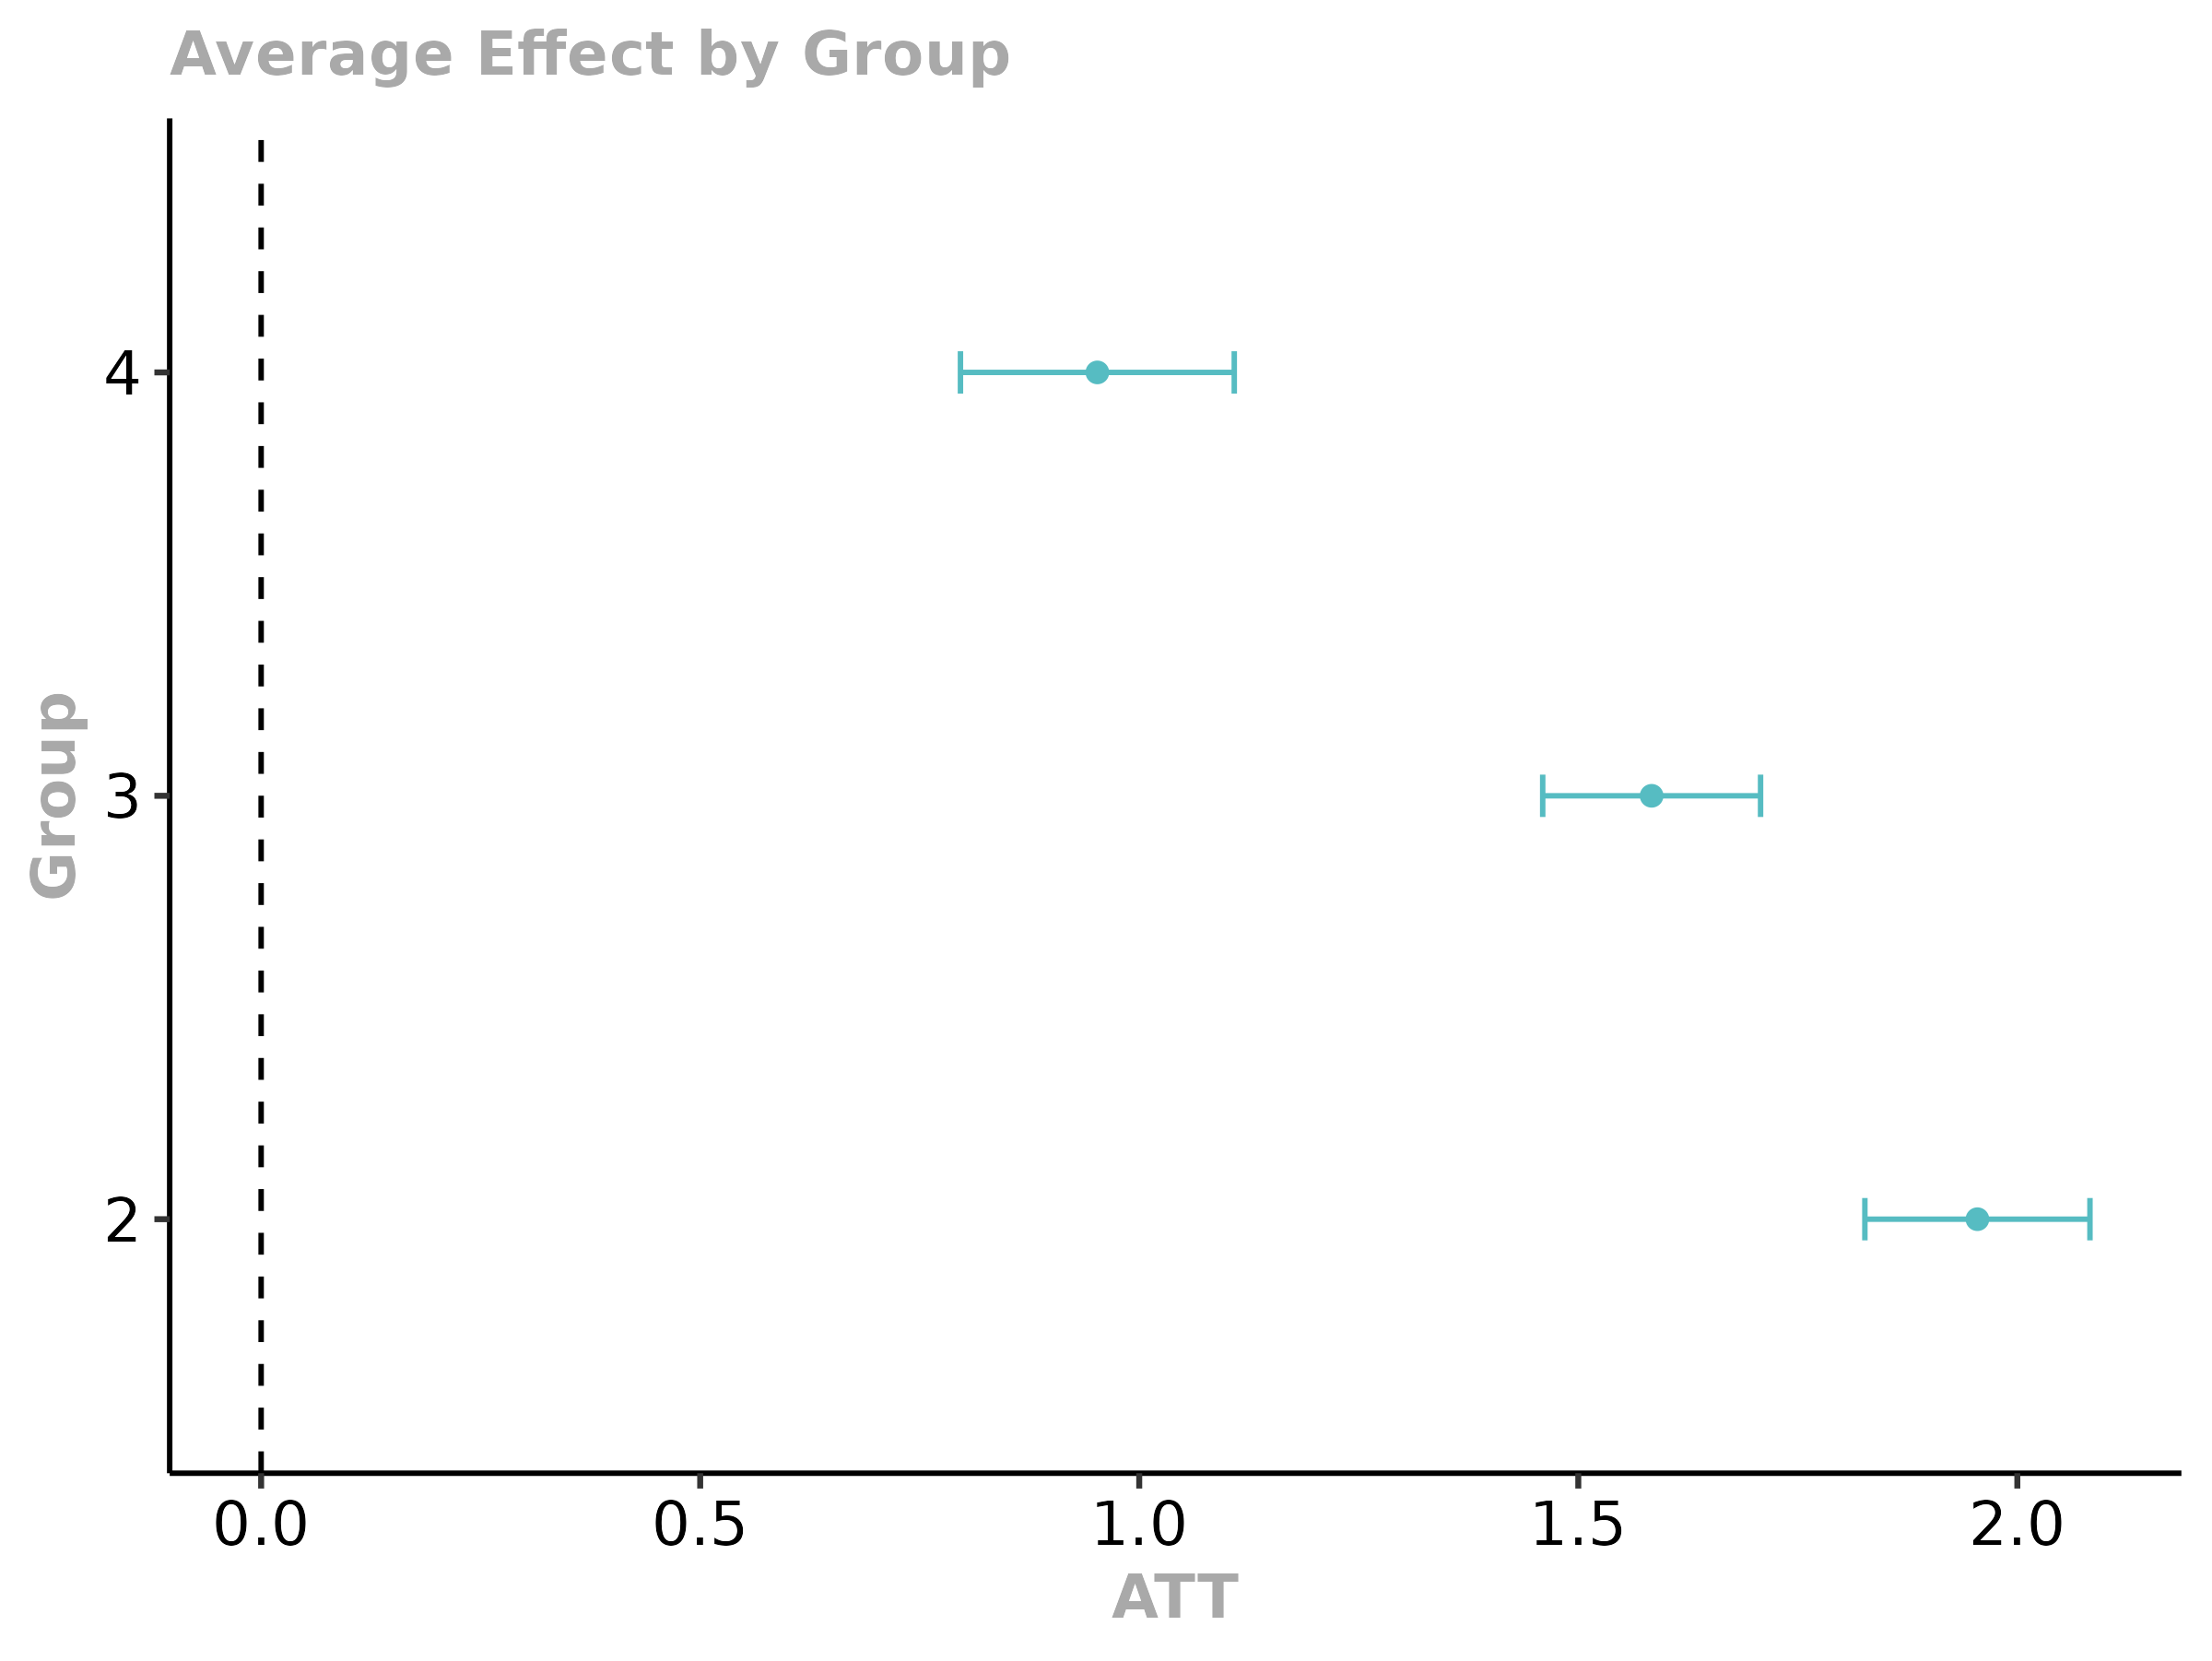
Average effect within each treatment cohort.
aggte(att, type = "group")
Before using this step, make its assumptions and its output explicit. A useful peer note explains what you would check, what could go wrong, or what would change your interpretation.
Questions to explore- Which assumption matters most here, and what evidence could challenge it?
- What would you check before passing this output to the next step?
Choose a question to start your comment.
Peer discussion
- Bring your experience, a question, or a different perspective.
Log in to comment on this step.
ggdid() event-study plot
Reporting — turn the numbers into a figure or table a reader can act on.
Plot pre-trends + dynamic effects with simultaneous confidence bands.
ggdid(es)
Before using this step, make its assumptions and its output explicit. A useful peer note explains what you would check, what could go wrong, or what would change your interpretation.
Questions to explore- Which assumption matters most here, and what evidence could challenge it?
- What would you check before passing this output to the next step?
Choose a question to start your comment.
Peer discussion
- Bring your experience, a question, or a different perspective.
Log in to comment on this step.
Inputs & data
A long panel with staggered treatment timing: unit id, period, the unit's first-treatment period (group), and an outcome.
Show data format & exampleHide example
Format — one row per (unit, period). first.treat = the period a unit is first treated (0 / Inf = never treated).
 id  period  first.treat   Y
  1     2004        2006    8.1
  1     2005        2006    8.4
  2     2004           0    7.9   # never treated
Figures reproduced from did — Callaway & Sant'Anna — unofficial community showcase; all credit to the original authors.
The flagship 'did' vignette (Callaway & Sant'Anna). Estimate ATT(g,t) against not-yet-treated controls, then aggregate to a dynamic event study. Unofficial summary.
Discuss the workflow (2)
Log in to join the discussion.
The whole point: never compare a treated unit to an already-treated one. att_gt() bakes that in. TWFE users, please switch.
And the dynamic aggregation gives you the event study for free, with simultaneous bands. Chef's kiss.
The not-yet-treated control group is what makes this robust to heterogeneous timing. Great default.