

@misc{grf,
  title        = {grf},
  author       = {Athey and Tibshirani and Wager},
  howpublished = {\url{https://grf-labs.github.io/grf/}},
  note         = {Software / documentation}
}Follow the analysis.
Select a node to explore the method
[GRF] Causal forest
The core estimate — where the causal quantity itself is computed.
Fit with OOB predictions and variance.
Causal forest — Honest random forest for heterogeneous treatment effects — CATE for a binary treatment via GRF moment conditions.
cf <- causal_forest(X, Y, W)          # Y.hat, W.hat cross-fit
tau.hat <- predict(cf)$predictions    # OOB CATEs

Before using this step, make its assumptions and its output explicit. A useful peer note explains what you would check, what could go wrong, or what would change your interpretation.
Questions to explore- Which assumption matters most here, and what evidence could challenge it?
- What would you check before passing this output to the next step?
Choose a question to start your comment.
Peer discussion
- Bring your experience, a question, or a different perspective.
Log in to comment on this step.
test_calibration()
A pre-flight check — run this before trusting any estimate downstream.
Mean-forest coefficient ≈ 1 says the average ATE is right; differential-forest coefficient ≈ 1 says heterogeneity is real.
test_calibration(cf) # mean & differential forest coefficients ≈ 1?
Before using this step, make its assumptions and its output explicit. A useful peer note explains what you would check, what could go wrong, or what would change your interpretation.
Questions to explore- Which assumption matters most here, and what evidence could challenge it?
- What would you check before passing this output to the next step?
Choose a question to start your comment.
Peer discussion
- Bring your experience, a question, or a different perspective.
Log in to comment on this step.
variable_importance()
A pre-flight check — run this before trusting any estimate downstream.
Which covariates the forest split on most often — sanity-check against domain knowledge.
variable_importance(cf)
Before using this step, make its assumptions and its output explicit. A useful peer note explains what you would check, what could go wrong, or what would change your interpretation.
Questions to explore- Which assumption matters most here, and what evidence could challenge it?
- What would you check before passing this output to the next step?
Choose a question to start your comment.
Peer discussion
- Bring your experience, a question, or a different perspective.
Log in to comment on this step.
best_linear_projection()
Heterogeneity — who is affected, and by how much, not just on average.
Linear projection of τ̂(x) on a hand-picked subset for human-readable heterogeneity.
best_linear_projection(cf, X[, c("age", "prior")])
Before using this step, make its assumptions and its output explicit. A useful peer note explains what you would check, what could go wrong, or what would change your interpretation.
Questions to explore- Which assumption matters most here, and what evidence could challenge it?
- What would you check before passing this output to the next step?
Choose a question to start your comment.
Peer discussion
- Bring your experience, a question, or a different perspective.
Log in to comment on this step.
OOB residual checks
A pre-flight check — run this before trusting any estimate downstream.
Plot OOB CATEs against propensity & key covariates; large structure left here = under-fitting.
Before using this step, make its assumptions and its output explicit. A useful peer note explains what you would check, what could go wrong, or what would change your interpretation.
Questions to explore- Which assumption matters most here, and what evidence could challenge it?
- What would you check before passing this output to the next step?
Choose a question to start your comment.
Peer discussion
- Bring your experience, a question, or a different perspective.
Log in to comment on this step.
Fit-evaluation report
Reporting — turn the numbers into a figure or table a reader can act on.
Calibration table + importance bar chart + BLP table + residual scan, in one place.
Before using this step, make its assumptions and its output explicit. A useful peer note explains what you would check, what could go wrong, or what would change your interpretation.
Questions to explore- Which assumption matters most here, and what evidence could challenge it?
- What would you check before passing this output to the next step?
Choose a question to start your comment.
Peer discussion
- Bring your experience, a question, or a different perspective.
Log in to comment on this step.
Inputs & data
A fitted causal forest (n=2000, p=10) you want to validate before trusting.
Show data format & exampleHide example
Format — one row per unit. A covariate matrix X (numeric), a binary treatment W ∈ {0,1}, and an outcome Y.
  X1     X2    X3    W    Y
 0.42  -1.1   0     1   3.10
-0.07   0.6   1     0   1.85
 1.20   0.3   0     1   4.02
Figures reproduced from grf — Athey, Tibshirani & Wager — unofficial community showcase; all credit to the original authors.
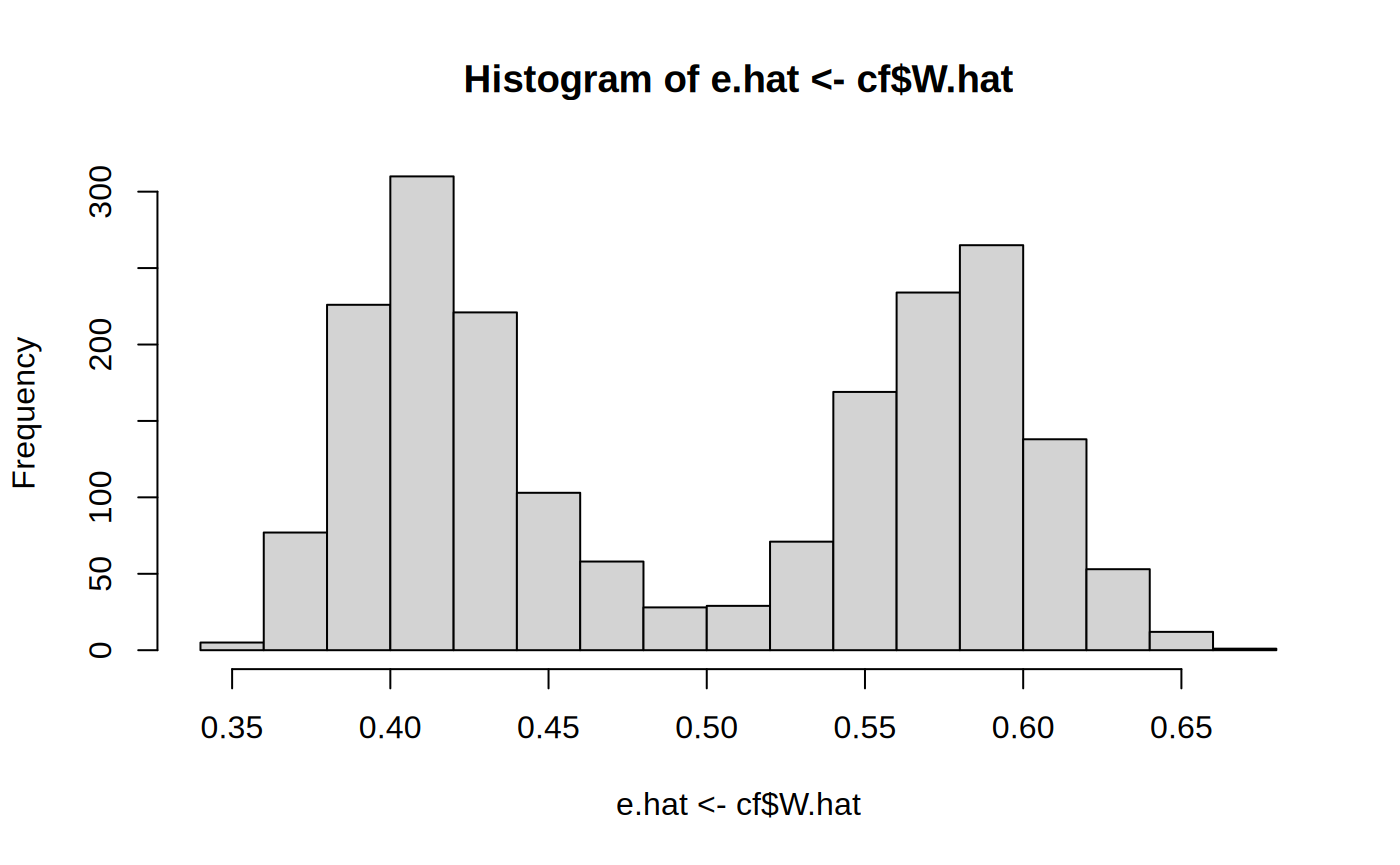
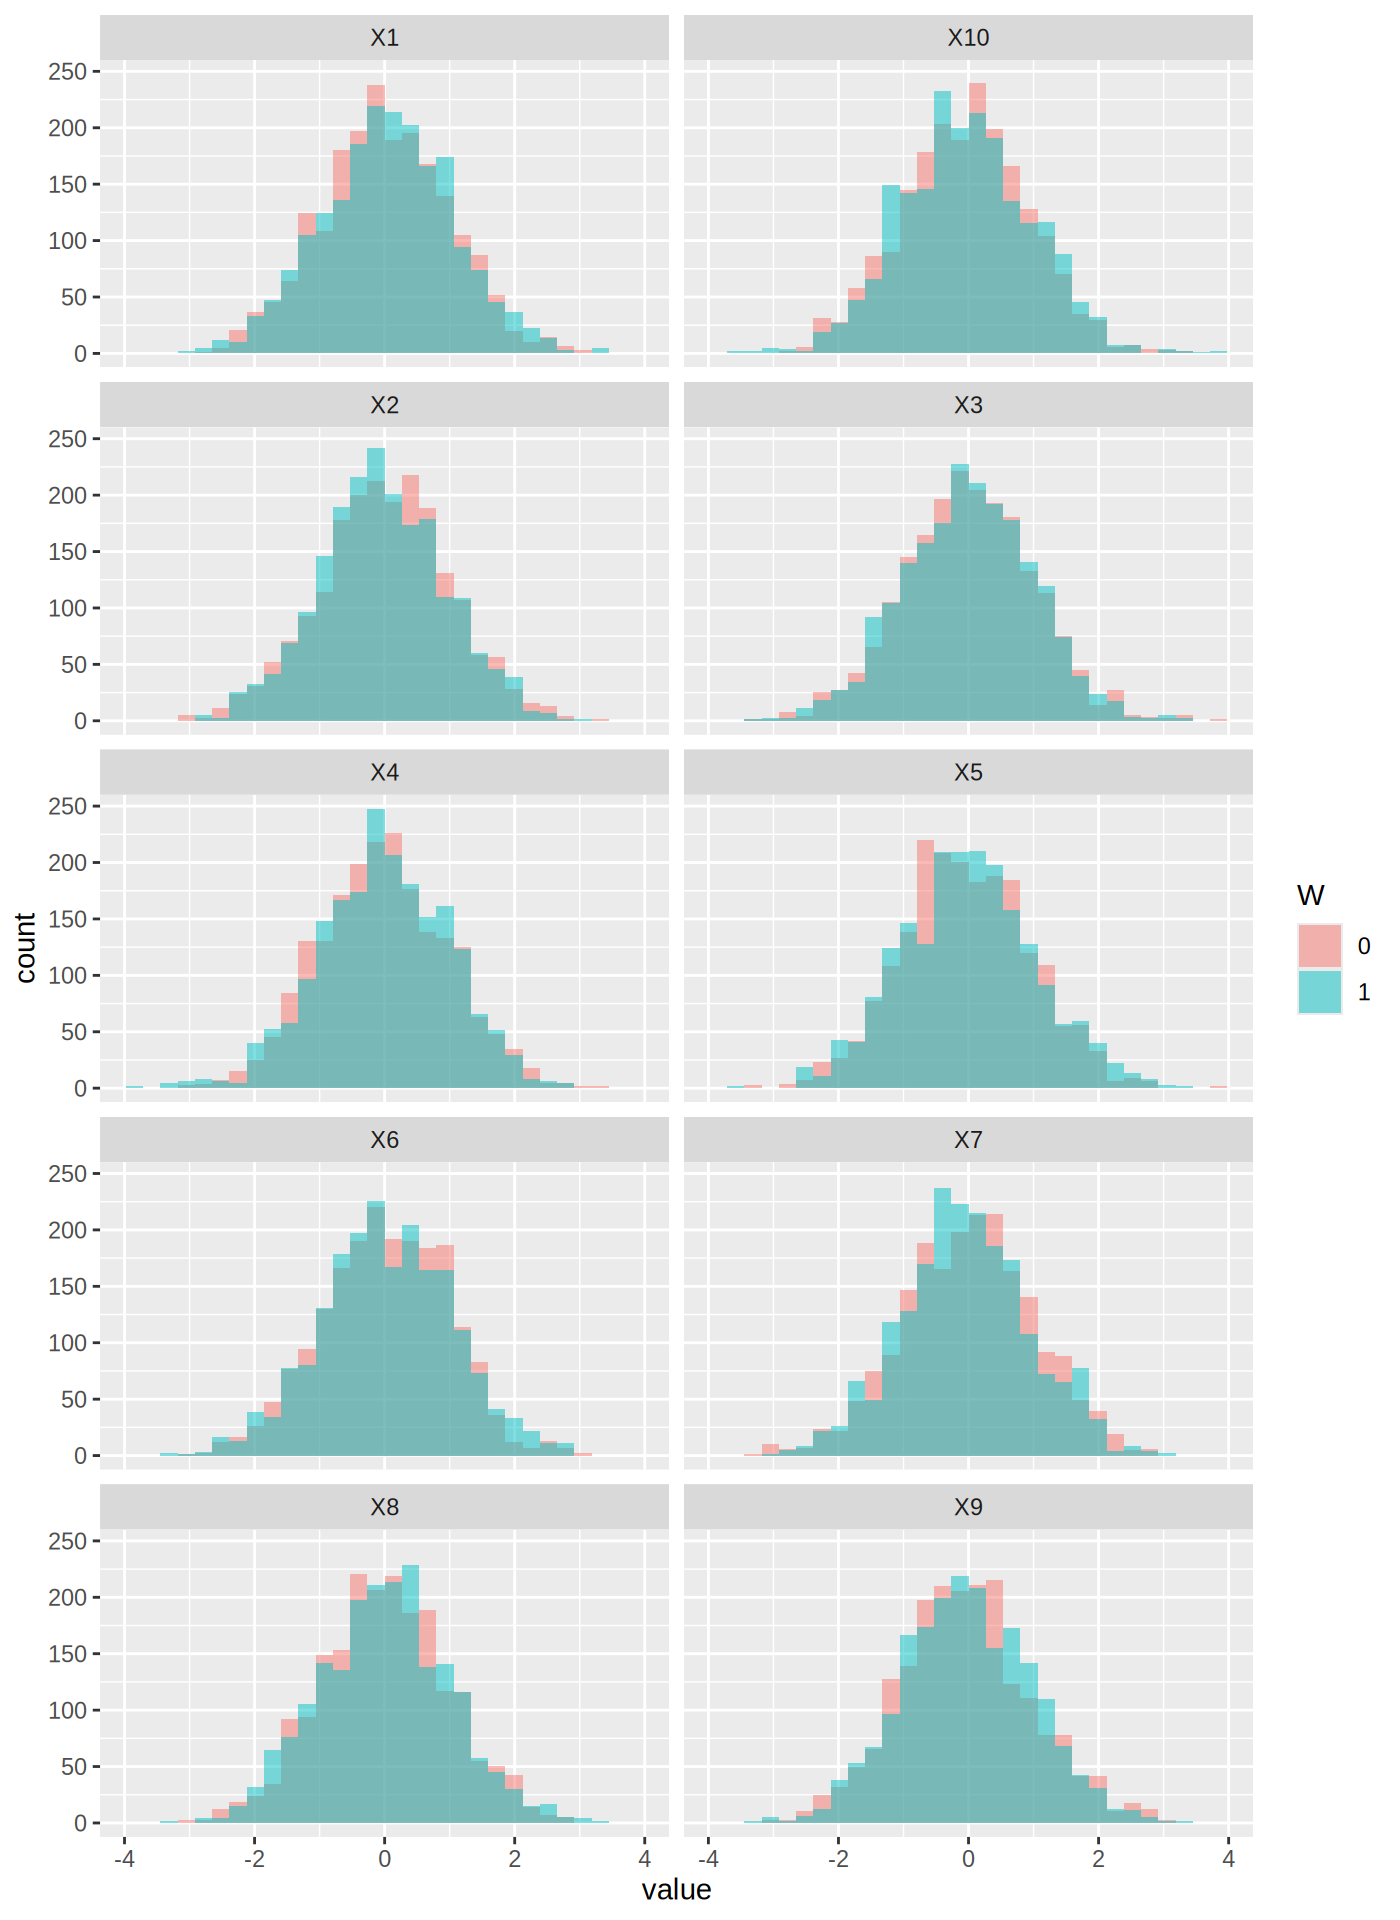
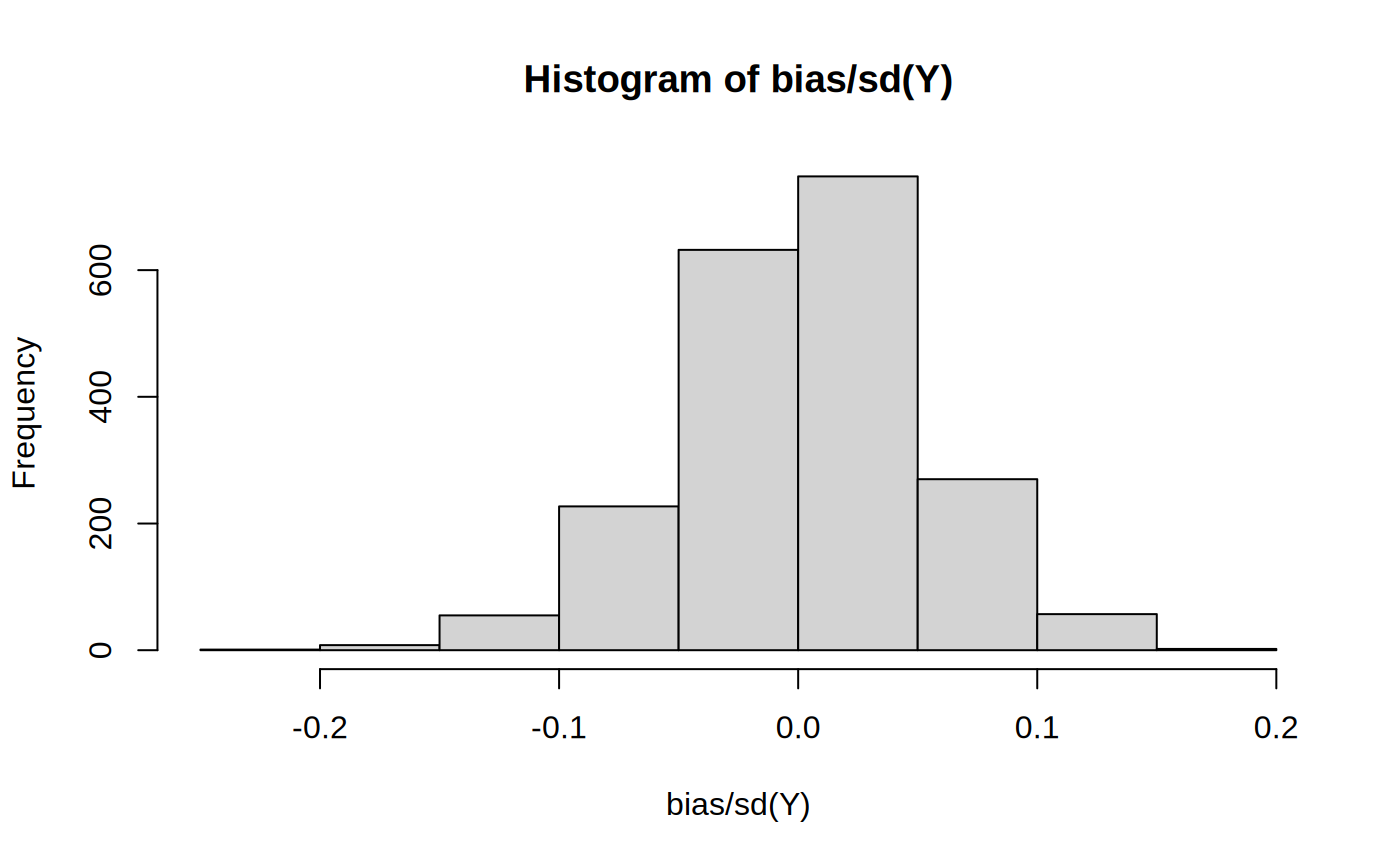
The GRF 'Evaluating a causal forest fit' tutorial. Before reading anything off a fitted forest, check that it's well-calibrated and that the heterogeneity isn't an artifact of noise. Then look at what's driving the splits and how the CATE relates to interpretable covariates. Unofficial summary.
Discuss the workflow (0)
Log in to join the discussion.