
Goodman-Bacon decomposition: what your TWFE estimate is averaging (bacondecomp)

@misc{bacondecomp,
  title        = {bacondecomp},
  author       = {2021},
  howpublished = {\url{https://github.com/evanjflack/bacondecomp}},
  note         = {Software / documentation}
}Follow the analysis.
Select a node to explore the method
A staggered-adoption panel
Data preparation — shapes the raw inputs into what the estimator expects.
Units switch treatment on at different dates. The TWFE coefficient you'd normally report hides a lot of structure.
# unit, year, y, treated (0/1, turns on and stays on)

Before using this step, make its assumptions and its output explicit. A useful peer note explains what you would check, what could go wrong, or what would change your interpretation.
Questions to explore- Which assumption matters most here, and what evidence could challenge it?
- What would you check before passing this output to the next step?
Choose a question to start your comment.
Peer discussion
- Bring your experience, a question, or a different perspective.
Log in to comment on this step.
Decompose into 2×2 comparisons
A pre-flight check — run this before trusting any estimate downstream.
Every pair of timing groups forms a 2×2 DiD; TWFE is their variance-weighted average.
df_bacon <- bacon(y ~ treated, data = panel,
                  id_var = 'unit', time_var = 'year')
Before using this step, make its assumptions and its output explicit. A useful peer note explains what you would check, what could go wrong, or what would change your interpretation.
Questions to explore- Which assumption matters most here, and what evidence could challenge it?
- What would you check before passing this output to the next step?
Choose a question to start your comment.
Peer discussion
- Bring your experience, a question, or a different perspective.
Log in to comment on this step.
Spot the forbidden comparisons
A robustness check — does the headline result survive a different lens?
'Later vs earlier treated' uses already-treated units as controls — under dynamic effects this term is biased and can carry negative weight.
library(ggplot2)
ggplot(df_bacon, aes(weight, estimate, color = type)) + geom_point()
Before using this step, make its assumptions and its output explicit. A useful peer note explains what you would check, what could go wrong, or what would change your interpretation.
Questions to explore- Which assumption matters most here, and what evidence could challenge it?
- What would you check before passing this output to the next step?
Choose a question to start your comment.
Peer discussion
- Bring your experience, a question, or a different perspective.
Log in to comment on this step.
Read β as a weighted average
Reporting — turn the numbers into a figure or table a reader can act on.
If the dangerous comparisons carry real weight, prefer a modern estimator (Callaway-Sant'Anna, did2s) over plain TWFE.
weighted.mean(df_bacon$estimate, df_bacon$weight)
Before using this step, make its assumptions and its output explicit. A useful peer note explains what you would check, what could go wrong, or what would change your interpretation.
Questions to explore- Which assumption matters most here, and what evidence could challenge it?
- What would you check before passing this output to the next step?
Choose a question to start your comment.
Peer discussion
- Bring your experience, a question, or a different perspective.
Log in to comment on this step.
Inputs & data
A staggered-adoption panel: units adopting treatment at different times, with a binary treatment indicator.
Show data format & exampleHide example
Format — long panel: unit, time, outcome y, treatment treated (0/1, absorbing).
library(bacondecomp)
df_bacon <- bacon(y ~ treated, data = panel,
                  id_var = 'unit', time_var = 'year')
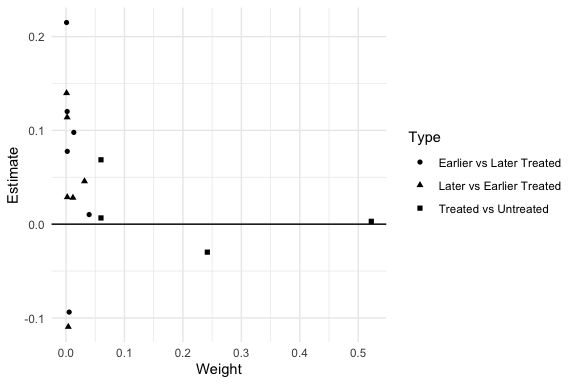
Figures reproduced from bacondecomp — Flack; Goodman-Bacon (2021) — unofficial community showcase; all credit to the original authors.
⚠️ Unofficial community showcase of bacondecomp. Not affiliated with the authors; all credit to them.
A two-way fixed-effects DiD is a weighted average of all possible 2×2 comparisons — including 'forbidden' ones that use already-treated units as controls. This shows you the weights.
Discuss the workflow (2)
Log in to join the discussion.
Every staggered-DiD paper should print this plot. Once you see the 'later vs earlier treated' weight, you can't unsee the TWFE problem.
Great diagnostic, but it's a diagnosis not a cure — pair it with Callaway-Sant'Anna or did2s when the bad comparisons carry weight.