
Policy learning via optimal decision trees

@misc{grf,
  title        = {grf},
  author       = {Athey and Tibshirani and Wager},
  howpublished = {\url{https://grf-labs.github.io/grf/}},
  note         = {Software / documentation}
}Follow the analysis.
Select a node to explore the method
[GRF] Causal forest
The core estimate — where the causal quantity itself is computed.
Estimate CATEs and the AIPW score for each unit.
Causal forest — Honest random forest for heterogeneous treatment effects — CATE for a binary treatment via GRF moment conditions.
cf <- causal_forest(X, Y, W)          # Y.hat, W.hat cross-fit
tau.hat <- predict(cf)$predictions    # OOB CATEs

Before using this step, make its assumptions and its output explicit. A useful peer note explains what you would check, what could go wrong, or what would change your interpretation.
Questions to explore- Which assumption matters most here, and what evidence could challenge it?
- What would you check before passing this output to the next step?
Choose a question to start your comment.
Peer discussion
- Bring your experience, a question, or a different perspective.
Log in to comment on this step.
double_robust_scores()
Data preparation — shapes the raw inputs into what the estimator expects.
Build the doubly-robust reward matrix policytree maximizes over.
dr.scores <- double_robust_scores(cf) # n × K reward matrix
Before using this step, make its assumptions and its output explicit. A useful peer note explains what you would check, what could go wrong, or what would change your interpretation.
Questions to explore- Which assumption matters most here, and what evidence could challenge it?
- What would you check before passing this output to the next step?
Choose a question to start your comment.
Peer discussion
- Bring your experience, a question, or a different perspective.
Log in to comment on this step.
policytree: depth-2 optimal tree
The core estimate — where the causal quantity itself is computed.
Learn an interpretable assignment rule that maximizes expected welfare.
library(policytree)
tree <- policy_tree(X, dr.scores, depth = 2)
plot(tree)
Before using this step, make its assumptions and its output explicit. A useful peer note explains what you would check, what could go wrong, or what would change your interpretation.
Questions to explore- Which assumption matters most here, and what evidence could challenge it?
- What would you check before passing this output to the next step?
Choose a question to start your comment.
Peer discussion
- Bring your experience, a question, or a different perspective.
Log in to comment on this step.
Evaluate policy value (held-out)
Uncertainty quantification — standard errors, intervals, and aggregation.
Estimate the value of the learned rule vs treat-all / treat-none on held-out data.
# value of the learned rule vs treat-all / treat-none on held-out data
mean(dr.scores[cbind(seq_len(n), predict(tree, X))])
Before using this step, make its assumptions and its output explicit. A useful peer note explains what you would check, what could go wrong, or what would change your interpretation.
Questions to explore- Which assumption matters most here, and what evidence could challenge it?
- What would you check before passing this output to the next step?
Choose a question to start your comment.
Peer discussion
- Bring your experience, a question, or a different perspective.
Log in to comment on this step.
Plot the learned decision tree
Reporting — turn the numbers into a figure or table a reader can act on.
Show the tree and the value comparison.
Before using this step, make its assumptions and its output explicit. A useful peer note explains what you would check, what could go wrong, or what would change your interpretation.
Questions to explore- Which assumption matters most here, and what evidence could challenge it?
- What would you check before passing this output to the next step?
Choose a question to start your comment.
Peer discussion
- Bring your experience, a question, or a different perspective.
Log in to comment on this step.
Inputs & data
Per-unit CATEs / doubly-robust scores from a causal forest, plus a cost.
Show data format & exampleHide example
Format — one row per unit. A covariate matrix X (numeric), a binary treatment W ∈ {0,1}, and an outcome Y.
  X1     X2    X3    W    Y
 0.42  -1.1   0     1   3.10
-0.07   0.6   1     0   1.85
 1.20   0.3   0     1   4.02
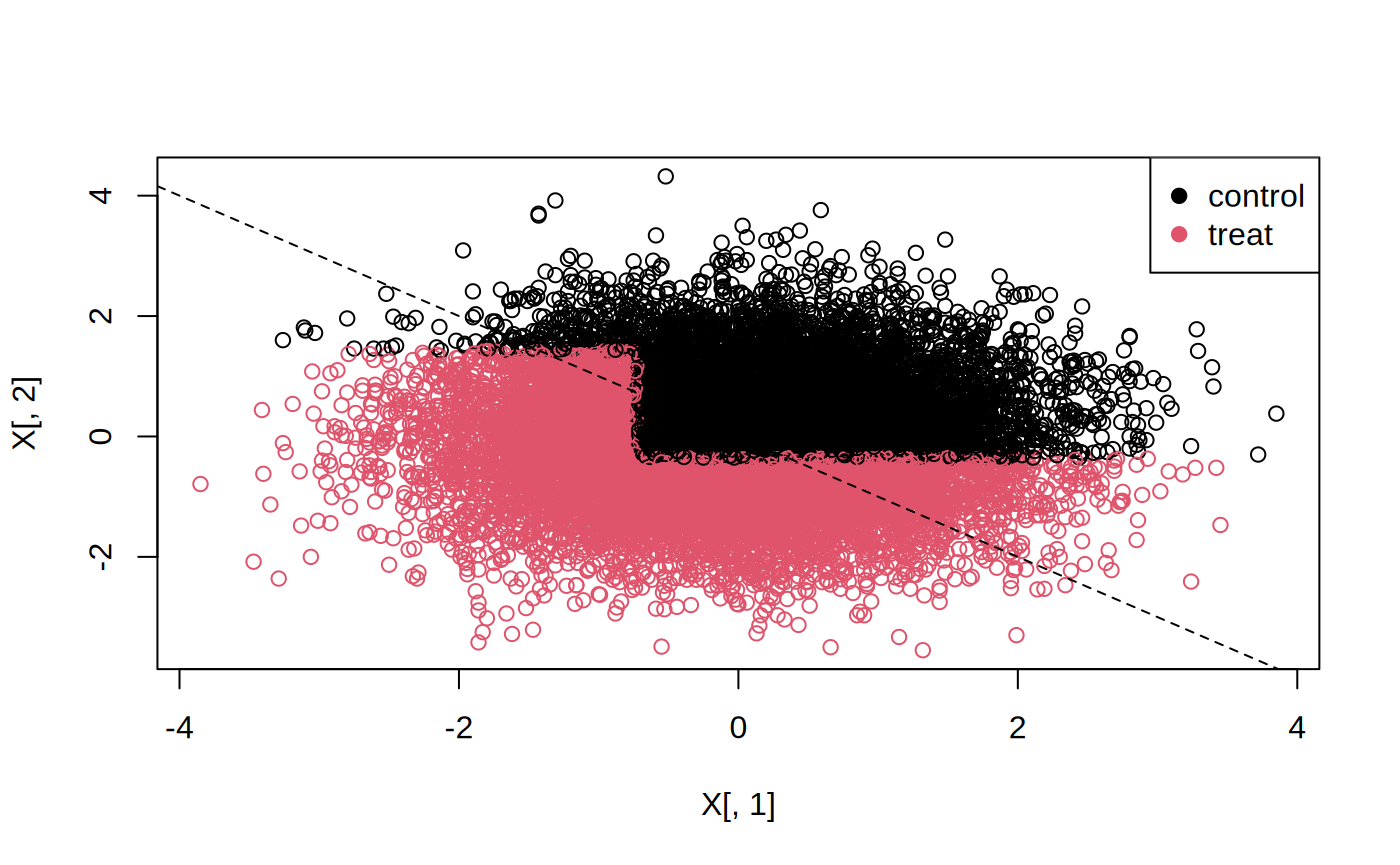
Figures reproduced from grf — Athey, Tibshirani & Wager — unofficial community showcase; all credit to the original authors.
The GRF + policytree tutorial: turn CATEs into an interpretable, near-optimal treatment rule and honestly evaluate its value. Unofficial summary; policytree is a separate grf-labs package.
Discuss the workflow (2)
Log in to join the discussion.
Depth-2 trees hit the sweet spot: near-optimal but you can actually explain the rule to ops. The held-out value evaluation keeps you honest.
The 'evaluate vs treat-all/treat-none' baseline is what convinces stakeholders. Always include it.
Doubly-robust scores as the policytree reward is the key link. Garbage scores → garbage policy.