
Quantile treatment effects of 401(k) eligibility (DoubleML)

@misc{doubleml,
  title        = {DoubleML},
  author       = {Bach and Chernozhukov and Kurz and Spindler},
  howpublished = {\url{https://docs.doubleml.org/}},
  note         = {Software / documentation}
}Follow the analysis.
Select a node to explore the method
Build DoubleMLData (net_tfa, e401, X)
Data preparation — shapes the raw inputs into what the estimator expects.
Declare the outcome, the eligibility treatment, and covariates.
dml_data = dml.DoubleMLData(df, 'net_tfa', 'e401', x_cols=X)

Before using this step, make its assumptions and its output explicit. A useful peer note explains what you would check, what could go wrong, or what would change your interpretation.
Questions to explore- Which assumption matters most here, and what evidence could challenge it?
- What would you check before passing this output to the next step?
Choose a question to start your comment.
Peer discussion
- Bring your experience, a question, or a different perspective.
Log in to comment on this step.
Estimate QTEs across the distribution
The core estimate — where the causal quantity itself is computed.
A grid of quantiles, each a debiased potential-quantile contrast.
qte = dml.DoubleMLQTE(dml_data, ml_g, ml_m, quantiles=np.arange(.1,.95,.05)).fit()
Before using this step, make its assumptions and its output explicit. A useful peer note explains what you would check, what could go wrong, or what would change your interpretation.
Questions to explore- Which assumption matters most here, and what evidence could challenge it?
- What would you check before passing this output to the next step?
Choose a question to start your comment.
Peer discussion
- Bring your experience, a question, or a different perspective.
Log in to comment on this step.
Simultaneous confidence bands
Uncertainty quantification — standard errors, intervals, and aggregation.
Bootstrap joint bands so the whole QTE curve is covered at once.
qte.bootstrap(); qte.confint(joint=True)
Before using this step, make its assumptions and its output explicit. A useful peer note explains what you would check, what could go wrong, or what would change your interpretation.
Questions to explore- Which assumption matters most here, and what evidence could challenge it?
- What would you check before passing this output to the next step?
Choose a question to start your comment.
Peer discussion
- Bring your experience, a question, or a different perspective.
Log in to comment on this step.
Plot the QTE curve
Reporting — turn the numbers into a figure or table a reader can act on.
Effect against quantile τ — where in the distribution the policy bites.
# QTE vs quantile, with joint bands
Before using this step, make its assumptions and its output explicit. A useful peer note explains what you would check, what could go wrong, or what would change your interpretation.
Questions to explore- Which assumption matters most here, and what evidence could challenge it?
- What would you check before passing this output to the next step?
Choose a question to start your comment.
Peer discussion
- Bring your experience, a question, or a different perspective.
Log in to comment on this step.
Inputs & data
Outcome Y (net assets), binary treatment D (eligibility), covariates X — the SIPP 401(k) sample.
Show data format & exampleHide example
Format — one row per household: net_tfa, e401 ∈ {0,1}, covariates X.
 net_tfa  e401  age  inc   educ
  12000     1    41  38k   13
   -400     0    53  21k   11
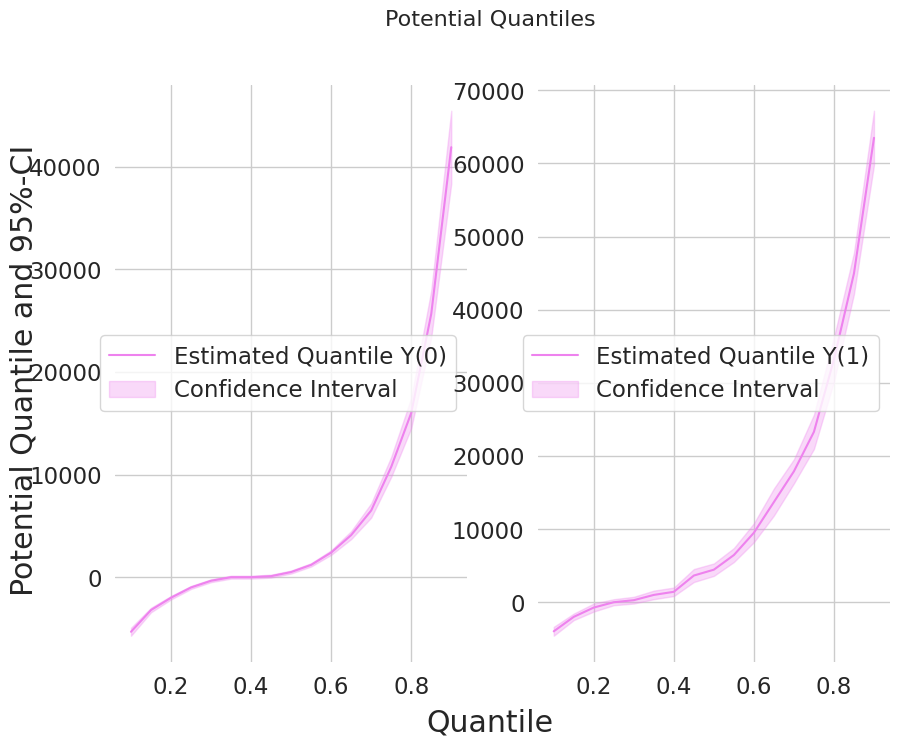
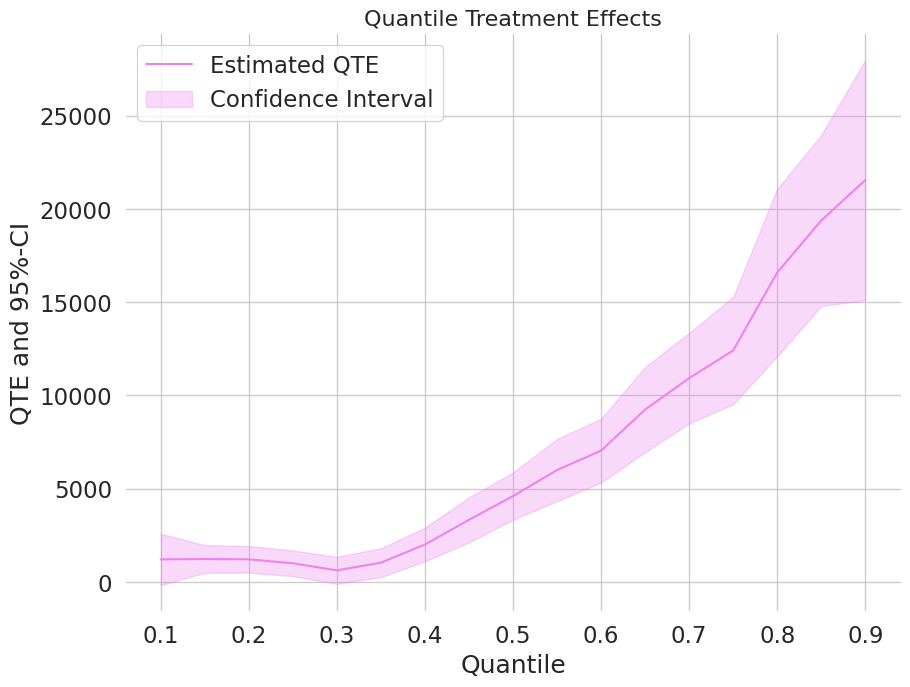
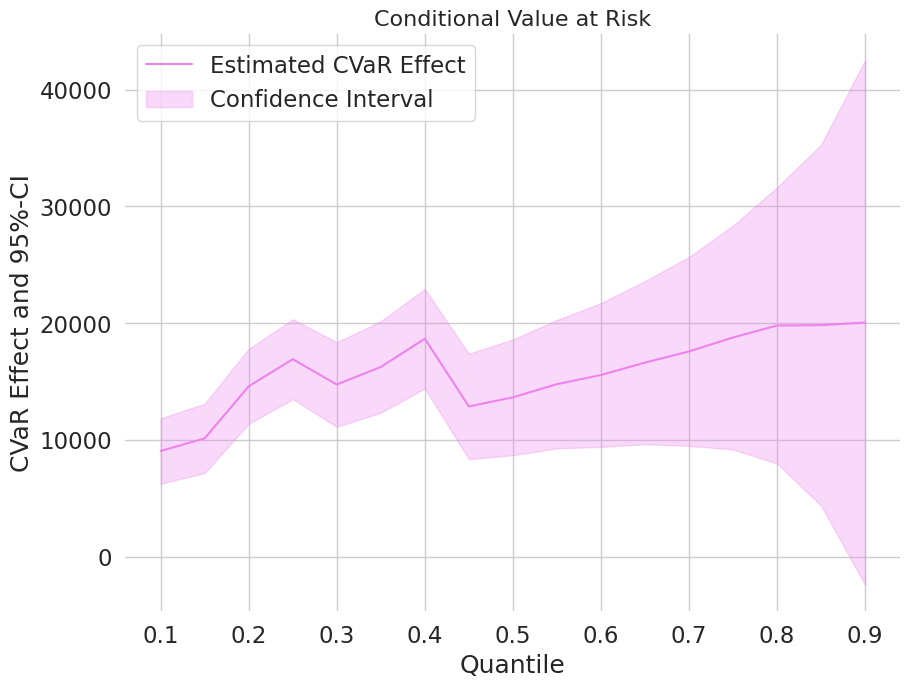
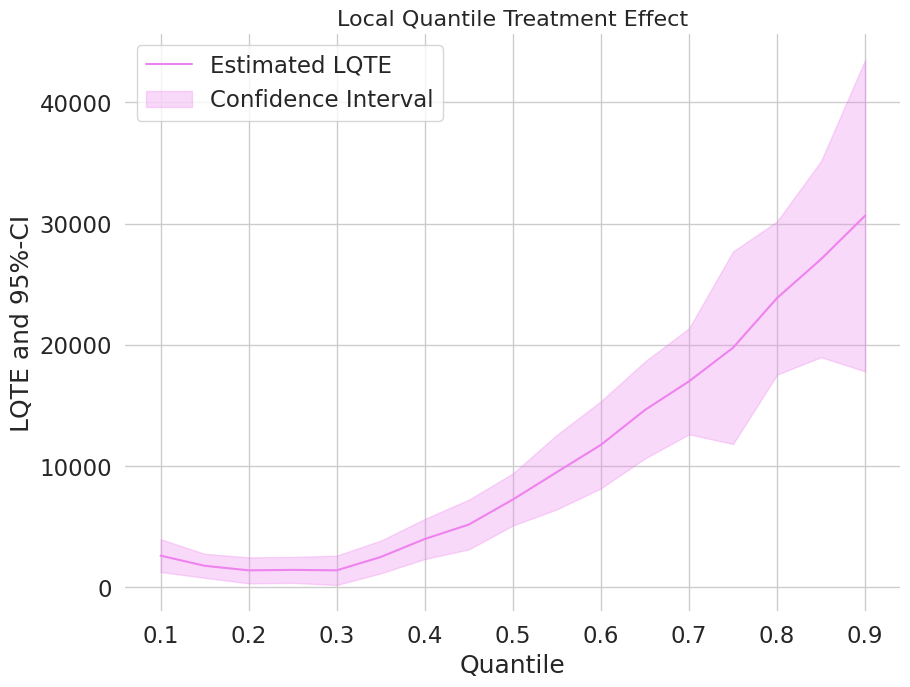
Figures reproduced from DoubleML — Bach, Chernozhukov, Kurz & Spindler — unofficial community showcase; all credit to the original authors.
⚠️ Unofficial community showcase of a DoubleML example. Not affiliated with the authors; figures are from the public documentation. All credit to Bach, Chernozhukov, Kurz & Spindler.
Beyond the average: how 401(k) eligibility shifts net financial assets across the whole wealth distribution, estimated orthogonally.
Discuss the workflow (0)
Log in to join the discussion.