
Sensitivity analysis for unobserved confounding (sensemakr)

@misc{sensemakr,
  title        = {sensemakr},
  author       = {Cinelli and Hazlett},
  howpublished = {\url{https://github.com/carloscinelli/sensemakr}},
  note         = {Software / documentation}
}Follow the analysis.
Select a node to explore the method
Fit the OLS outcome model
Data preparation — shapes the raw inputs into what the estimator expects.
Outcome ~ treatment + observed covariates.
fit <- lm(peacefactor ~ directlyharmed + age + female + ..., data = darfur)

Before using this step, make its assumptions and its output explicit. A useful peer note explains what you would check, what could go wrong, or what would change your interpretation.
Questions to explore- Which assumption matters most here, and what evidence could challenge it?
- What would you check before passing this output to the next step?
Choose a question to start your comment.
Peer discussion
- Bring your experience, a question, or a different perspective.
Log in to comment on this step.
[sensemakr] Sensitivity to unobserved confounding
The core estimate — where the causal quantity itself is computed.
Compute the robustness value and partial-R² sensitivity statistics.
Sensitivity to unobserved confounding — How strong would an unobserved confounder have to be to overturn your OLS result? Robustness values + contour plots, no extra assumptions.
s <- sensemakr(fit, treatment = "directlyharmed", benchmark_covariates = "female", kd = 1:3)
Before using this step, make its assumptions and its output explicit. A useful peer note explains what you would check, what could go wrong, or what would change your interpretation.
Questions to explore- Which assumption matters most here, and what evidence could challenge it?
- What would you check before passing this output to the next step?
Choose a question to start your comment.
Peer discussion
- Bring your experience, a question, or a different perspective.
Log in to comment on this step.
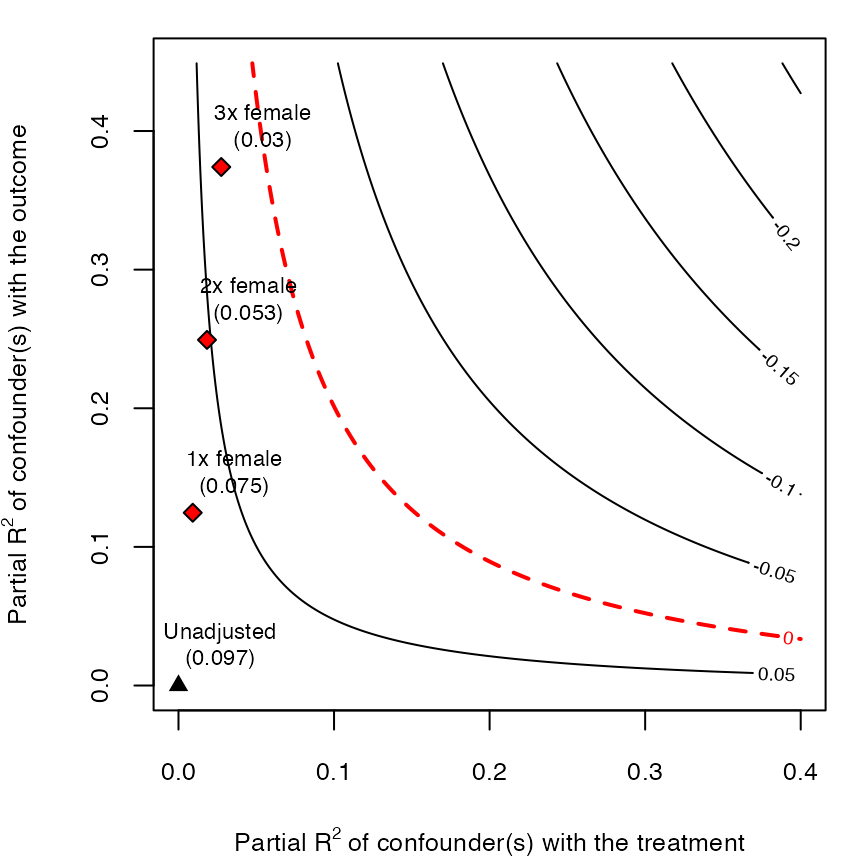
Contour plot — point estimate
Reporting — turn the numbers into a figure or table a reader can act on.
How strong must a confounder be (vs observed covariates) to drive the estimate to zero?
plot(s)
Before using this step, make its assumptions and its output explicit. A useful peer note explains what you would check, what could go wrong, or what would change your interpretation.
Questions to explore- Which assumption matters most here, and what evidence could challenge it?
- What would you check before passing this output to the next step?
Choose a question to start your comment.
Peer discussion
- Bring your experience, a question, or a different perspective.
Log in to comment on this step.
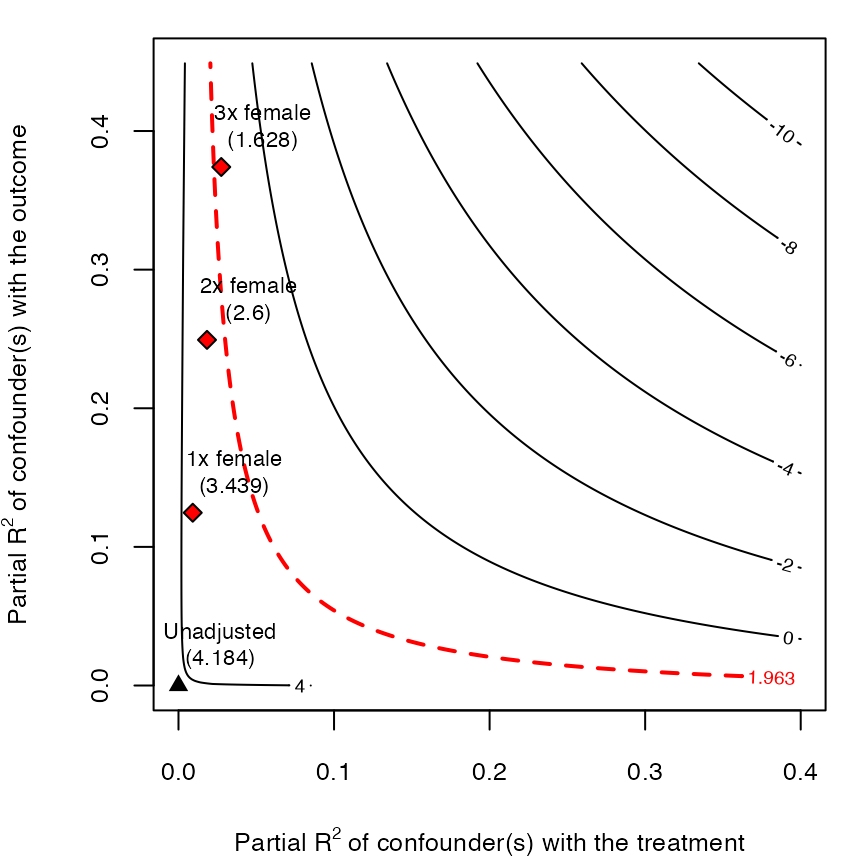
Contour plot — t-value
Reporting — turn the numbers into a figure or table a reader can act on.
Same, for statistical significance.
plot(s, sensitivity.of = "t-value")
Before using this step, make its assumptions and its output explicit. A useful peer note explains what you would check, what could go wrong, or what would change your interpretation.
Questions to explore- Which assumption matters most here, and what evidence could challenge it?
- What would you check before passing this output to the next step?
Choose a question to start your comment.
Peer discussion
- Bring your experience, a question, or a different perspective.
Log in to comment on this step.
Inputs & data
A fitted OLS outcome model: outcome ~ treatment + observed covariates.
Show data format & exampleHide example
Format — one row per unit: outcome Y, treatment D, covariates X.
   Y     D   X1   X2  ...
 3.2     1  0.4  -1.1
 1.8     0 -0.1   0.6
Figures reproduced from sensemakr — Cinelli & Hazlett — unofficial community showcase; all credit to the original authors.
The sensemakr vignette (Cinelli & Hazlett). Fit your model, then report how strong hidden confounding would need to be to change the conclusion. Unofficial summary.
Discuss the workflow (2)
Log in to join the discussion.
Unconfoundedness is an assumption, not a fact. sensemakr makes you state HOW wrong you could be. Every observational paper should include this.
The robustness value is such a clean one-number summary. 'A confounder would need to explain 15% of residual variance to overturn this.'
Benchmarking against observed covariates is the killer feature — 'as strong as 3× the effect of female' is interpretable.