
Sharp regression discontinuity with robust bias correction (rdrobust)
@misc{rdrobust,
  title        = {rdrobust},
  author       = {Calonico and Cattaneo and Farrell and Titiunik},
  howpublished = {\url{https://rdpackages.github.io/rdrobust/}},
  note         = {Software / documentation}
}Follow the analysis.
Select a node to explore the method
Running variable, cutoff, outcome
Data preparation — shapes the raw inputs into what the estimator expects.
Set up X, the threshold c, and Y. Identification rests on continuity at c.
library(rdrobust)
# x = running variable, c = cutoff, y = outcome

Before using this step, make its assumptions and its output explicit. A useful peer note explains what you would check, what could go wrong, or what would change your interpretation.
Questions to explore- Which assumption matters most here, and what evidence could challenge it?
- What would you check before passing this output to the next step?
Choose a question to start your comment.
Peer discussion
- Bring your experience, a question, or a different perspective.
Log in to comment on this step.
rdplot — see the jump
A pre-flight check — run this before trusting any estimate downstream.
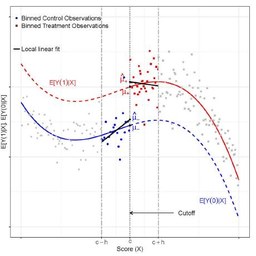
Binned means on each side reveal whether there's a discontinuity to estimate.
rdplot(y, x, c = 0)
Before using this step, make its assumptions and its output explicit. A useful peer note explains what you would check, what could go wrong, or what would change your interpretation.
Questions to explore- Which assumption matters most here, and what evidence could challenge it?
- What would you check before passing this output to the next step?
Choose a question to start your comment.
Peer discussion
- Bring your experience, a question, or a different perspective.
Log in to comment on this step.
Local-linear RD with bias correction
The core estimate — where the causal quantity itself is computed.
Fit local polynomials on each side at an MSE-optimal bandwidth; robust CIs.
rdrobust(y, x, c = 0)
Before using this step, make its assumptions and its output explicit. A useful peer note explains what you would check, what could go wrong, or what would change your interpretation.
Questions to explore- Which assumption matters most here, and what evidence could challenge it?
- What would you check before passing this output to the next step?
Choose a question to start your comment.
Peer discussion
- Bring your experience, a question, or a different perspective.
Log in to comment on this step.
Bandwidth & donut sensitivity
A robustness check — does the headline result survive a different lens?
Re-estimate across bandwidths and dropping points at the cutoff.
rdrobust(y, x, c = 0, h = c(h1, h2))
Before using this step, make its assumptions and its output explicit. A useful peer note explains what you would check, what could go wrong, or what would change your interpretation.
Questions to explore- Which assumption matters most here, and what evidence could challenge it?
- What would you check before passing this output to the next step?
Choose a question to start your comment.
Peer discussion
- Bring your experience, a question, or a different perspective.
Log in to comment on this step.
Inputs & data
A running variable X with a known cutoff c, and an outcome Y; treatment switches on at X ≥ c.
Show data format & exampleHide example
Format — one row per unit: running variable x, outcome y (cutoff c).
   x      y
 -0.8   2.1
  0.3   4.6   # x ≥ c → treated
 -0.1   2.9
⚠️ Unofficial community showcase of rdrobust. Not affiliated with the authors; all credit to them.
Identify the effect at a cutoff: a local-polynomial RD with an MSE-optimal bandwidth and robust, bias-corrected confidence intervals.
Discuss the workflow (0)
Log in to join the discussion.