
Smooth signals with a local linear forest

@misc{grf,
  title        = {grf},
  author       = {Athey and Tibshirani and Wager},
  howpublished = {\url{https://grf-labs.github.io/grf/}},
  note         = {Software / documentation}
}Follow the analysis.
Select a node to explore the method
[GRF] Regression forest
The core estimate — where the causal quantity itself is computed.
Baseline E[Y|X] fit — establish the score to beat.
Regression forest — Honest non-parametric regression for E[Y|X], with out-of-bag predictions and pointwise CIs.
rf <- regression_forest(X, Y)
Y.hat <- predict(rf)$predictions

Before using this step, make its assumptions and its output explicit. A useful peer note explains what you would check, what could go wrong, or what would change your interpretation.
Questions to explore- Which assumption matters most here, and what evidence could challenge it?
- What would you check before passing this output to the next step?
Choose a question to start your comment.
Peer discussion
- Bring your experience, a question, or a different perspective.
Log in to comment on this step.
[GRF] Local linear forest
The core estimate — where the causal quantity itself is computed.
Fit with a chosen set of `linear.correction.variables` (typically the smoothest covariates).
Local linear forest — Random forest with a local linear correction — smoother fits and better extrapolation for smooth signals.
llf <- ll_regression_forest(X, Y)
predict(llf, X.test, linear.correction.variables = 1:ncol(X))
Before using this step, make its assumptions and its output explicit. A useful peer note explains what you would check, what could go wrong, or what would change your interpretation.
Questions to explore- Which assumption matters most here, and what evidence could challenge it?
- What would you check before passing this output to the next step?
Choose a question to start your comment.
Peer discussion
- Bring your experience, a question, or a different perspective.
Log in to comment on this step.
Tune λ via cross-validation
A pre-flight check — run this before trusting any estimate downstream.
GRF ships `tune.ll.regression.forest`-style CV; pick the ridge penalty that minimizes held-out MSE.
Before using this step, make its assumptions and its output explicit. A useful peer note explains what you would check, what could go wrong, or what would change your interpretation.
Questions to explore- Which assumption matters most here, and what evidence could challenge it?
- What would you check before passing this output to the next step?
Choose a question to start your comment.
Peer discussion
- Bring your experience, a question, or a different perspective.
Log in to comment on this step.
Calibration & boundary plot
A pre-flight check — run this before trusting any estimate downstream.
Predicted vs observed near covariate boundaries — where local linear typically beats plain forests.
Before using this step, make its assumptions and its output explicit. A useful peer note explains what you would check, what could go wrong, or what would change your interpretation.
Questions to explore- Which assumption matters most here, and what evidence could challenge it?
- What would you check before passing this output to the next step?
Choose a question to start your comment.
Peer discussion
- Bring your experience, a question, or a different perspective.
Log in to comment on this step.
Side-by-side comparison
Reporting — turn the numbers into a figure or table a reader can act on.
MSE table and overlaid prediction curves; show where llf wins and where it doesn't matter.
Before using this step, make its assumptions and its output explicit. A useful peer note explains what you would check, what could go wrong, or what would change your interpretation.
Questions to explore- Which assumption matters most here, and what evidence could challenge it?
- What would you check before passing this output to the next step?
Choose a question to start your comment.
Peer discussion
- Bring your experience, a question, or a different perspective.
Log in to comment on this step.
Inputs & data
Outcome Y with a smooth dependence on continuous covariates X.
Show data format & exampleHide example
Format — one row per unit. A covariate matrix X and an outcome Y (no treatment needed).
  X1     X2    X3     Y
 0.42  -1.1   0.2   3.10
-0.07   0.6  -0.5   1.85
 1.20   0.3   0.1   4.02
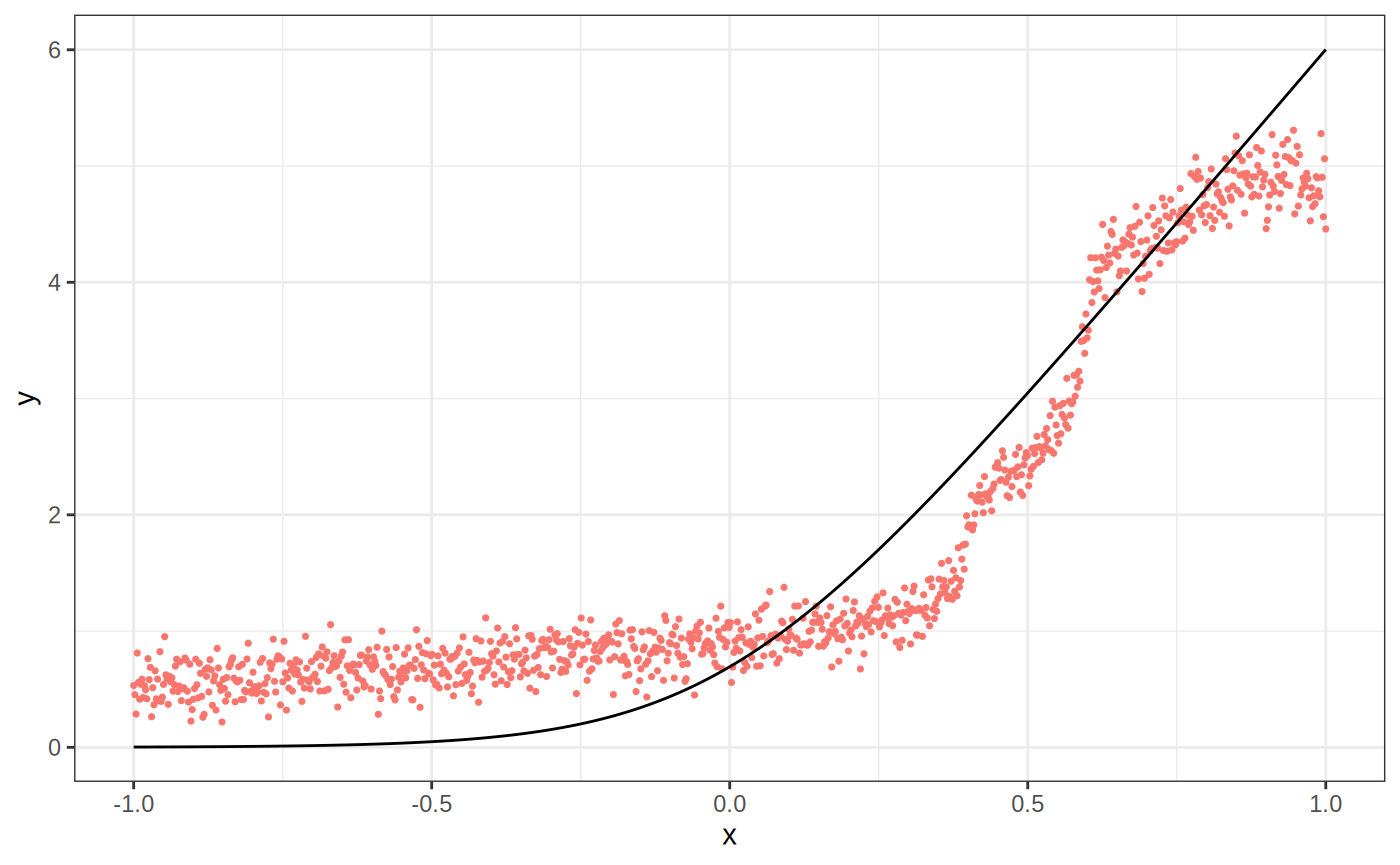
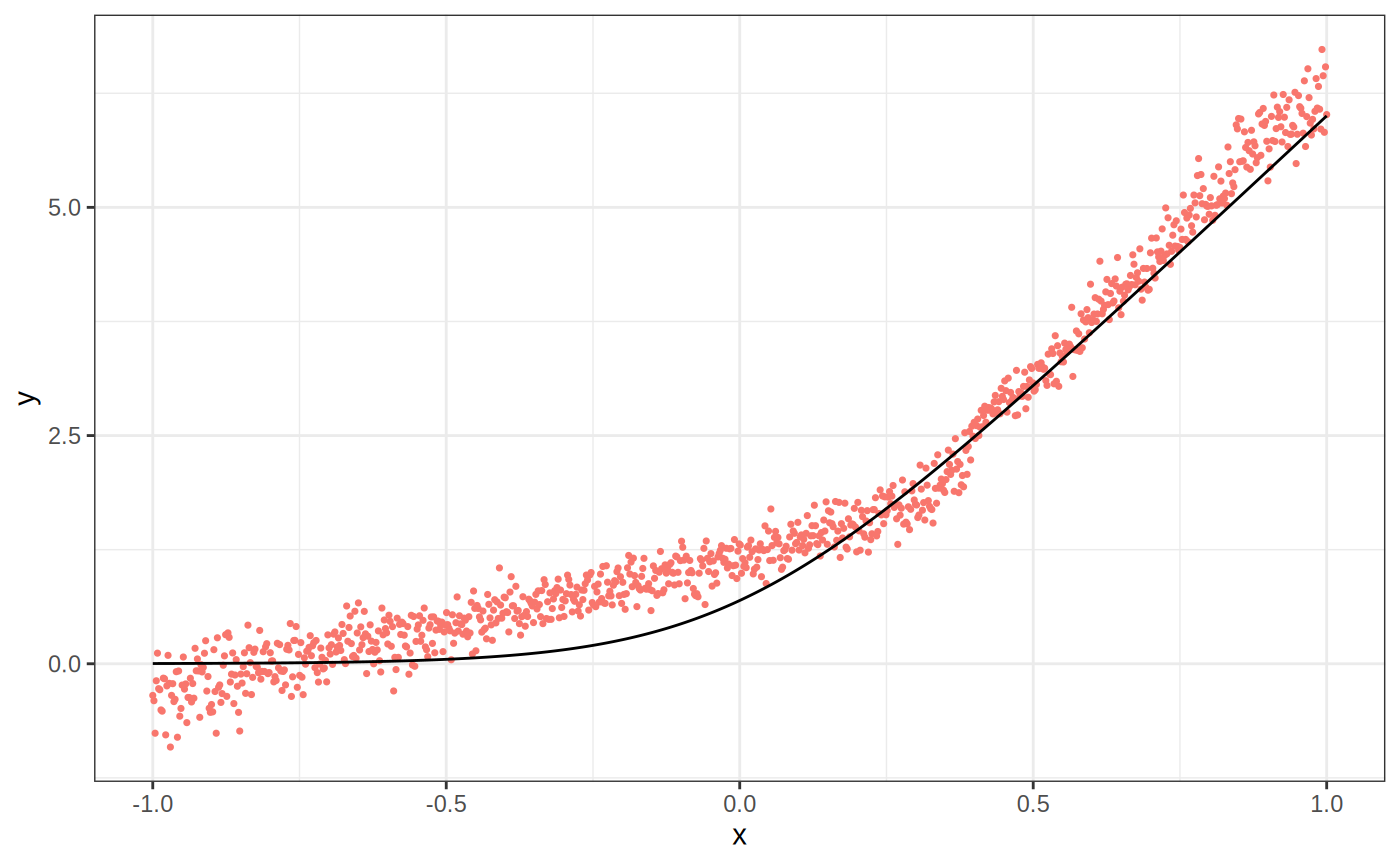
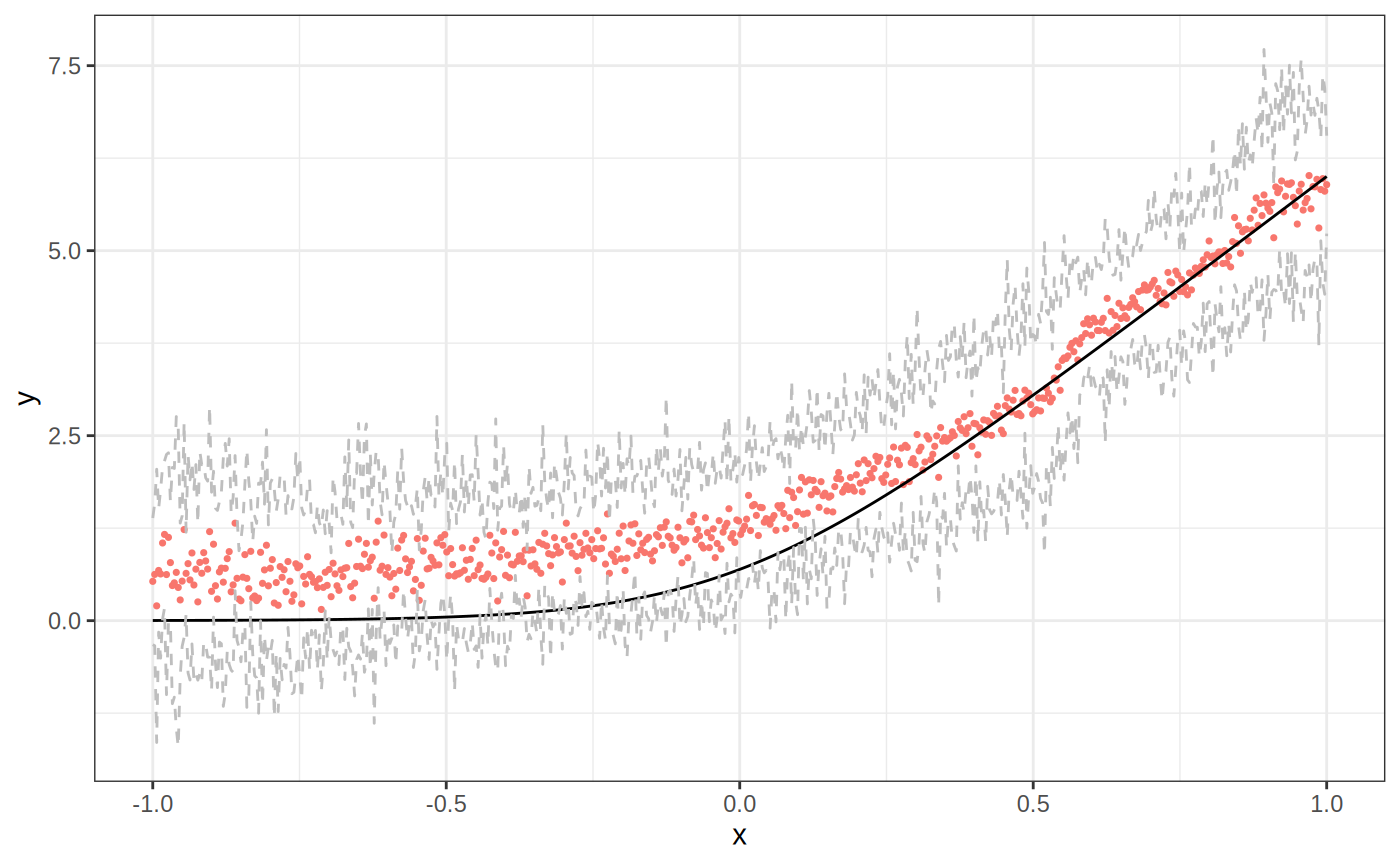
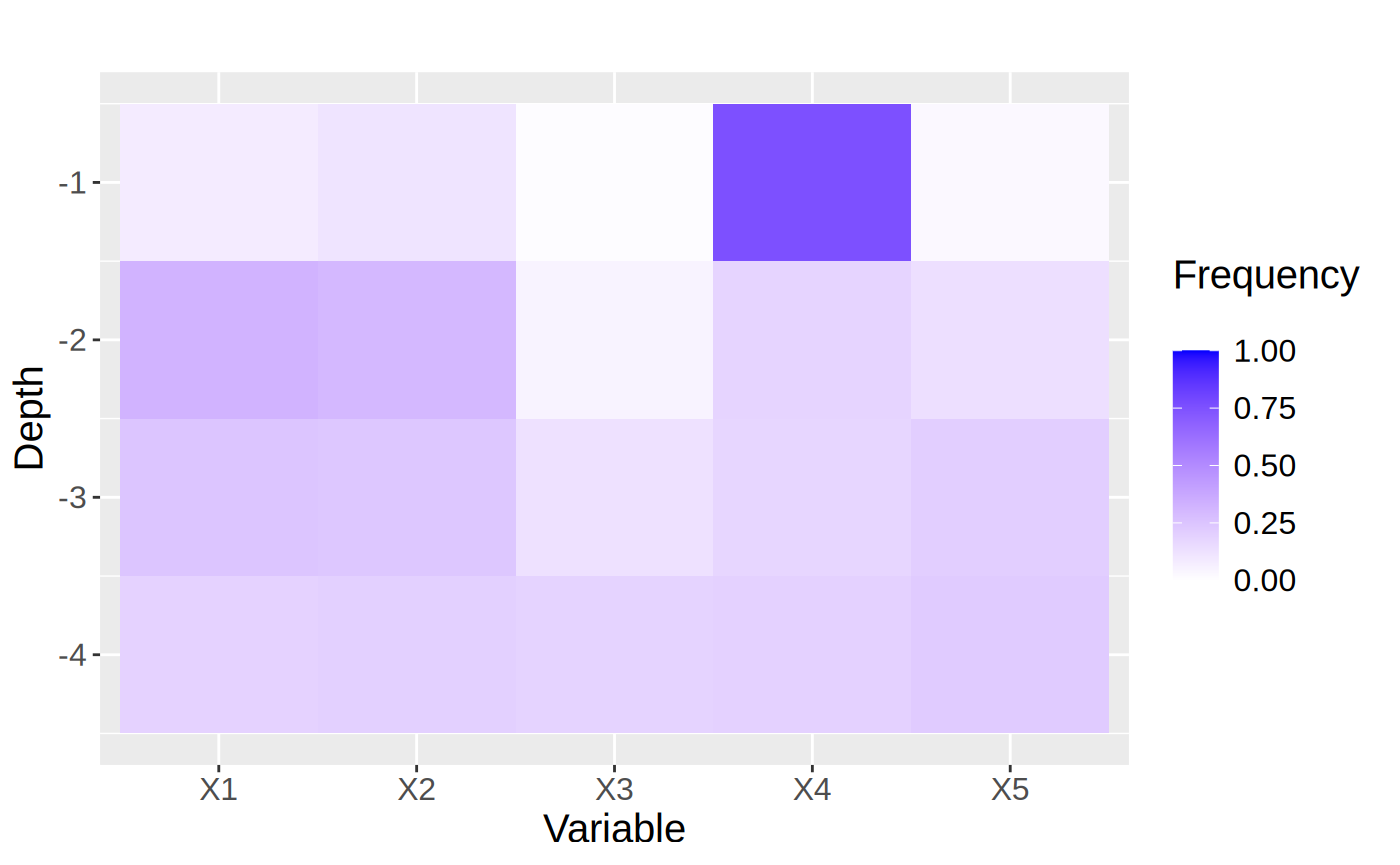
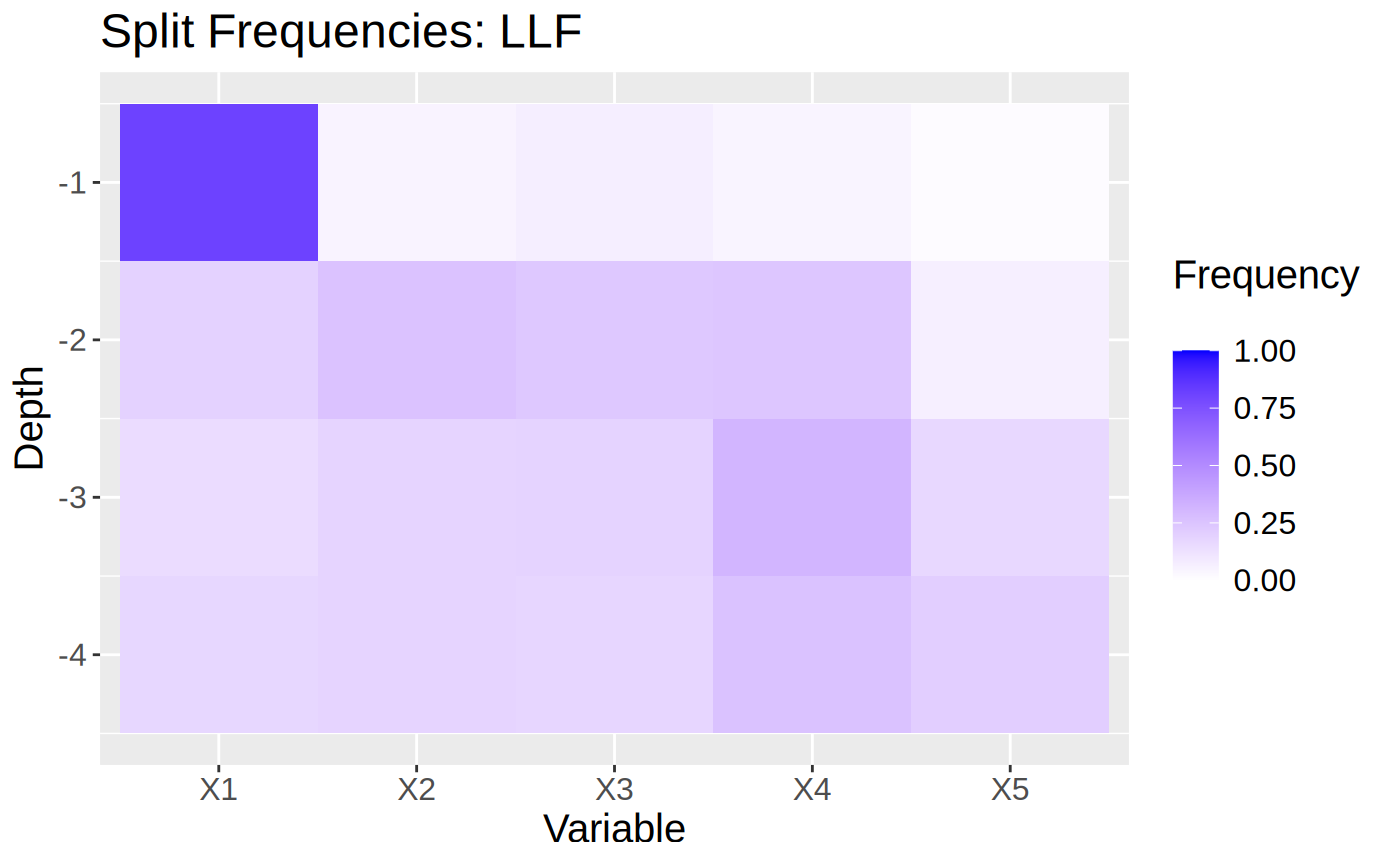
Figures reproduced from grf — Athey, Tibshirani & Wager — unofficial community showcase; all credit to the original authors.
The GRF 'Local linear forests' tutorial. The plain forest can show staircase artifacts near boundaries and on smooth signals; the local linear correction smooths these out and improves extrapolation. Unofficial summary.
Discuss the workflow (0)
Log in to join the discussion.