
Staggered DiD done three ways (did · did2s · fixest)
Follow the analysis.
Select a node to explore the method
Build the staggered panel
Data preparation — shapes the raw inputs into what the estimator expects.
One row per (unit, period); never-treated units get cohort 0 / Inf.
# id · period · cohort (first treated) · y
head(panel)

Before using this step, make its assumptions and its output explicit. A useful peer note explains what you would check, what could go wrong, or what would change your interpretation.
Questions to explore- Which assumption matters most here, and what evidence could challenge it?
- What would you check before passing this output to the next step?
Choose a question to start your comment.
Peer discussion
- Bring your experience, a question, or a different perspective.
Log in to comment on this step.
att_gt() — Callaway & Sant'Anna
The core estimate — where the causal quantity itself is computed.
ATT(g,t) against not-yet-treated controls, aggregated to a dynamic event study.
att <- att_gt("y","period","id","cohort", data=panel)
es_cs <- aggte(att, type="dynamic")
Before using this step, make its assumptions and its output explicit. A useful peer note explains what you would check, what could go wrong, or what would change your interpretation.
Questions to explore- Which assumption matters most here, and what evidence could challenge it?
- What would you check before passing this output to the next step?
Choose a question to start your comment.
Peer discussion
- Bring your experience, a question, or a different perspective.
Log in to comment on this step.
did2s() — Gardner two-stage
The core estimate — where the causal quantity itself is computed.
Gardner's two-stage estimator on the same panel — fast, timing-robust.
es_2s <- did2s(panel, yname="y", first_stage=~0|id+period,
               second_stage=~i(rel_year), treatment="treat", cluster_var="id")
Before using this step, make its assumptions and its output explicit. A useful peer note explains what you would check, what could go wrong, or what would change your interpretation.
Questions to explore- Which assumption matters most here, and what evidence could challenge it?
- What would you check before passing this output to the next step?
Choose a question to start your comment.
Peer discussion
- Bring your experience, a question, or a different perspective.
Log in to comment on this step.
sunab() — Sun & Abraham (fixest)
The core estimate — where the causal quantity itself is computed.
Interaction-weighted Sun–Abraham event study via fixest.
es_sa <- feols(y ~ sunab(cohort, period) | id + period, panel)
Before using this step, make its assumptions and its output explicit. A useful peer note explains what you would check, what could go wrong, or what would change your interpretation.
Questions to explore- Which assumption matters most here, and what evidence could challenge it?
- What would you check before passing this output to the next step?
Choose a question to start your comment.
Peer discussion
- Bring your experience, a question, or a different perspective.
Log in to comment on this step.
Overlay the three event studies
Reporting — turn the numbers into a figure or table a reader can act on.
Plot CS, did2s and Sun–Abraham together; agreement is the evidence.
# overlay es_cs, es_2s, es_sa on one event-time axis
Before using this step, make its assumptions and its output explicit. A useful peer note explains what you would check, what could go wrong, or what would change your interpretation.
Questions to explore- Which assumption matters most here, and what evidence could challenge it?
- What would you check before passing this output to the next step?
Choose a question to start your comment.
Peer discussion
- Bring your experience, a question, or a different perspective.
Log in to comment on this step.
Inputs & data
A long, staggered panel: unit id, period, the unit's first-treatment period (cohort), and an outcome.
Show data format & exampleHide example
Format — one row per (unit, period). cohort = first treated period (0 = never).
 id  period  cohort   y
  1     2004     2006   8.1
  1     2005     2006   8.4
  2     2004        0   7.9   # never treated
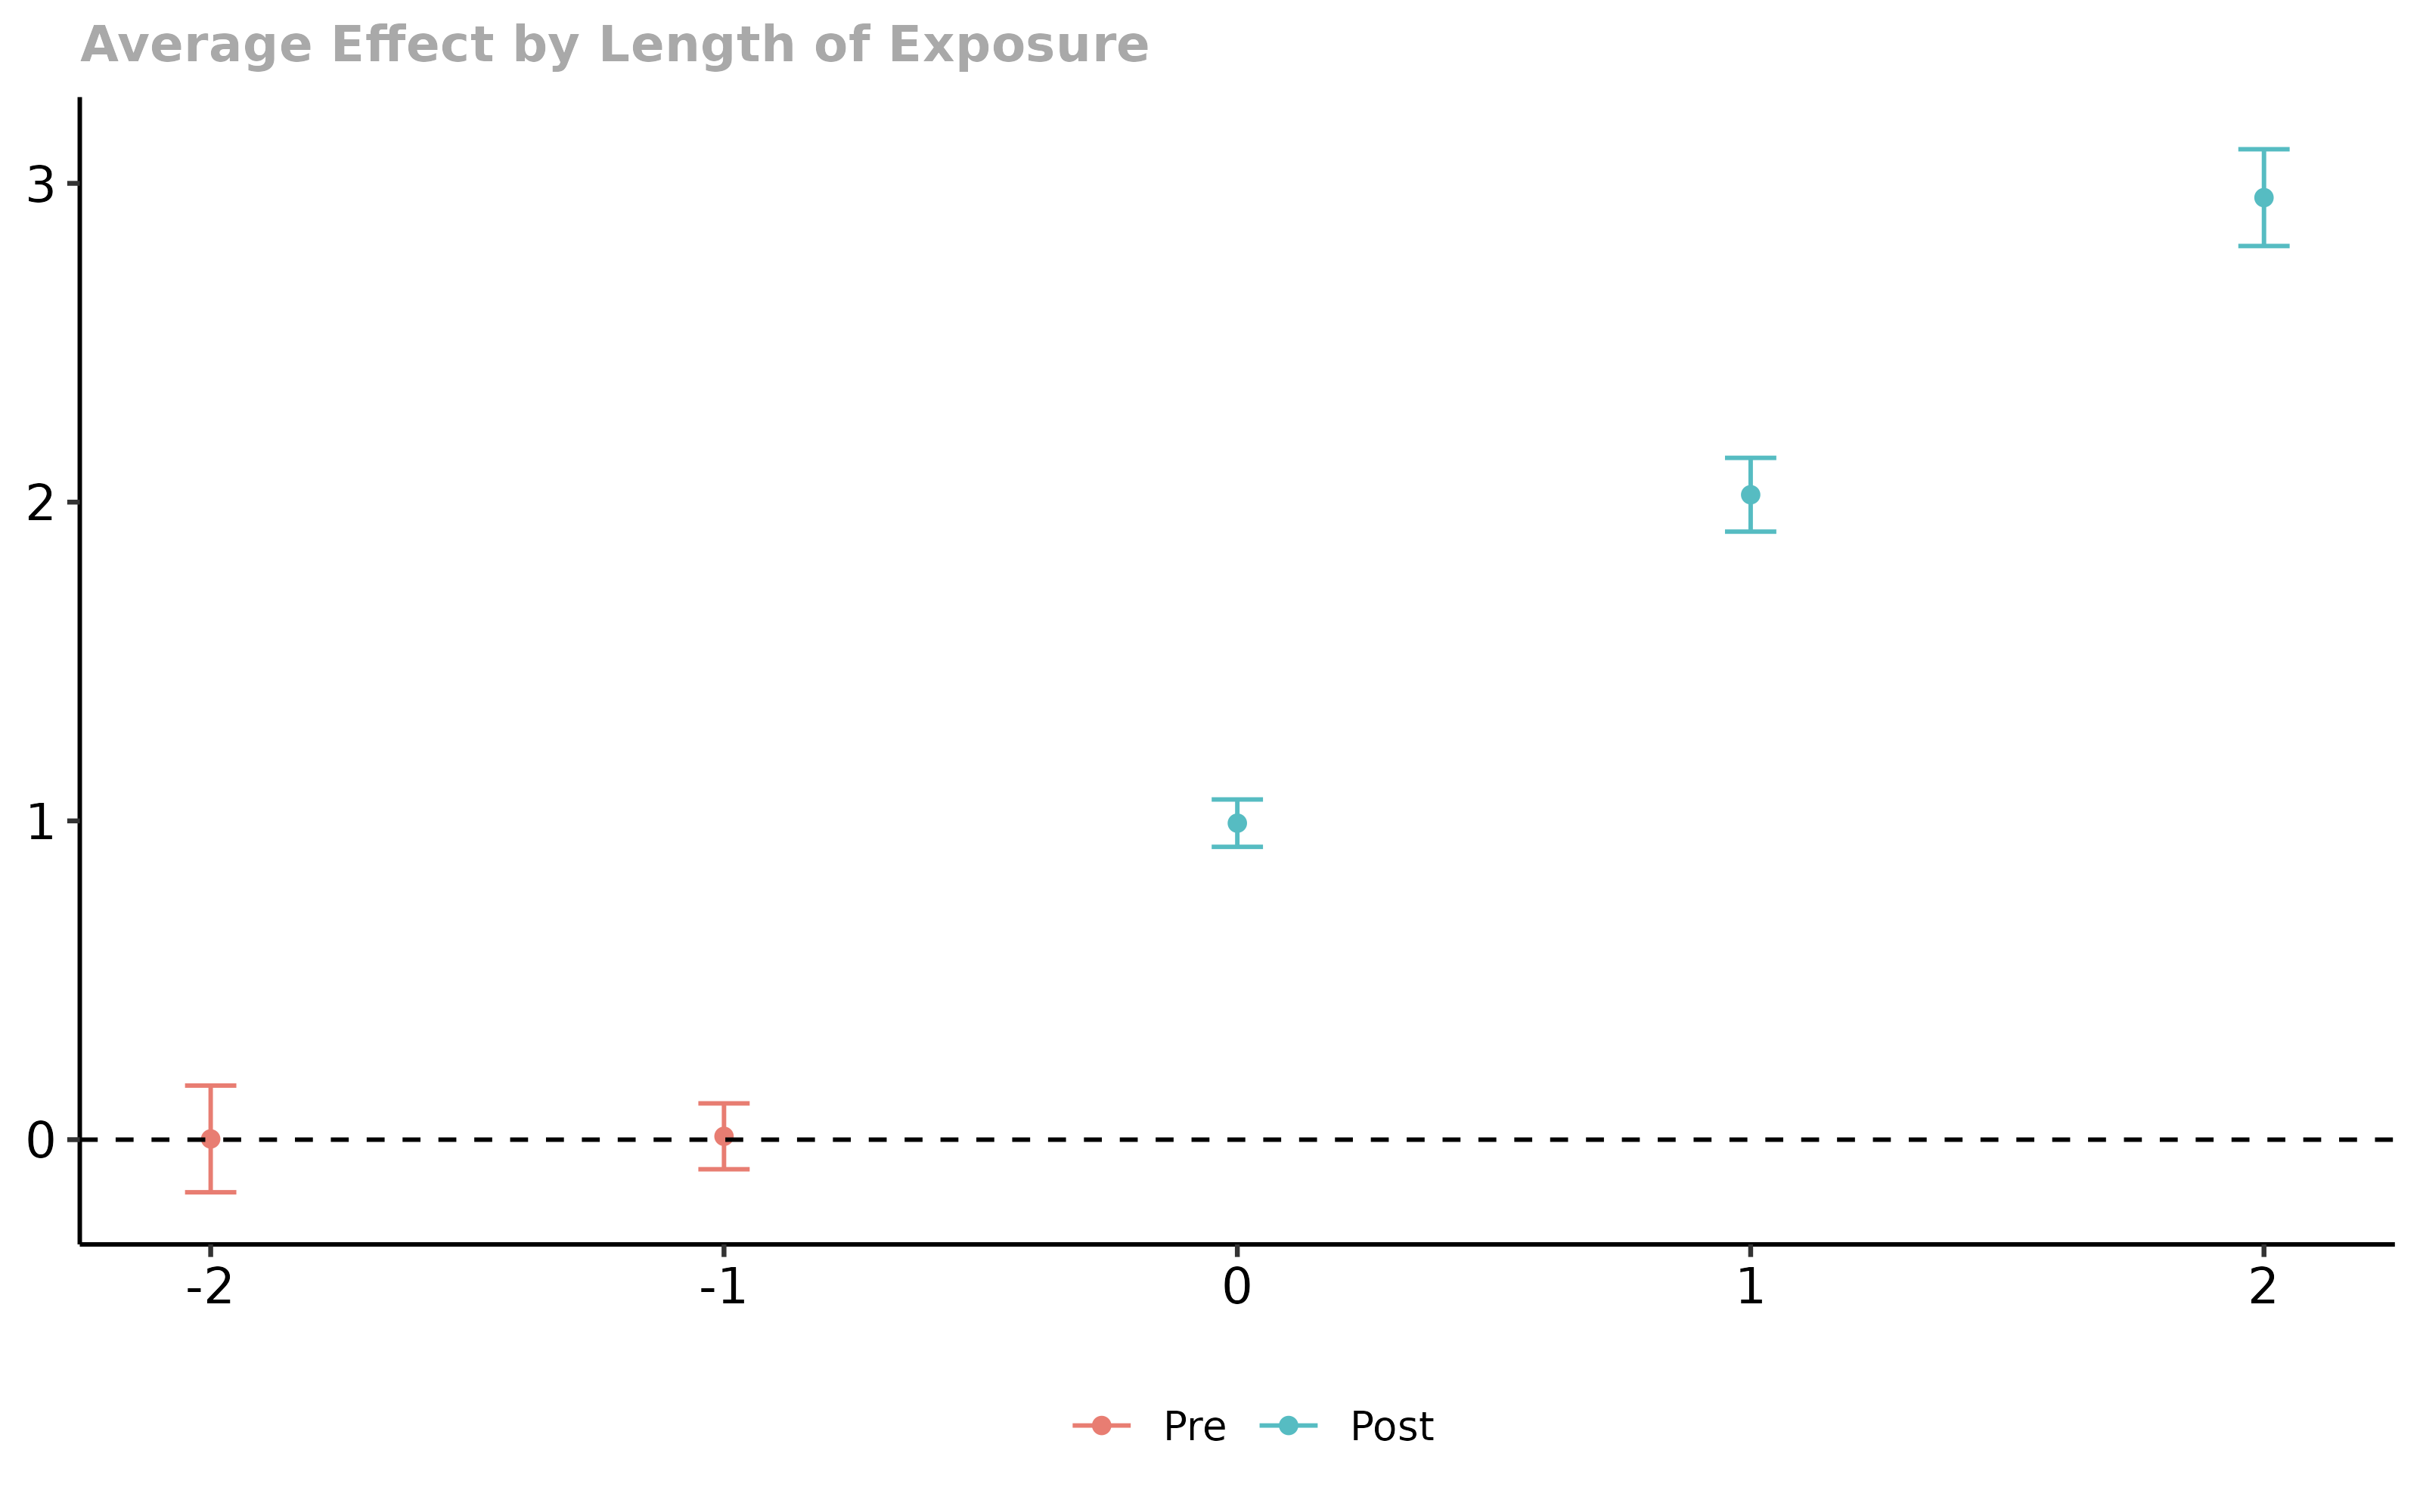
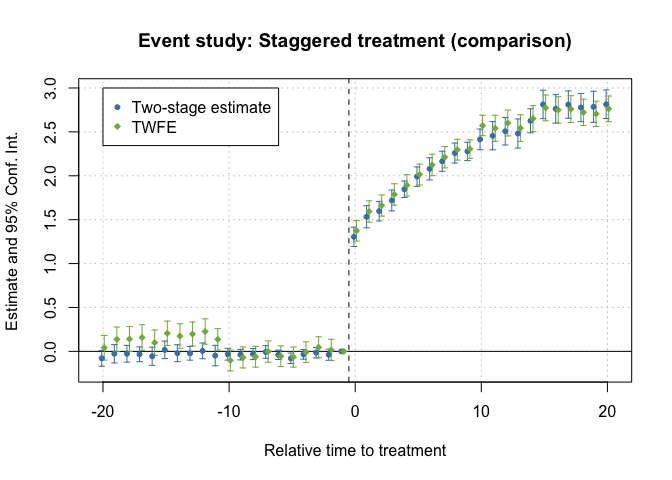
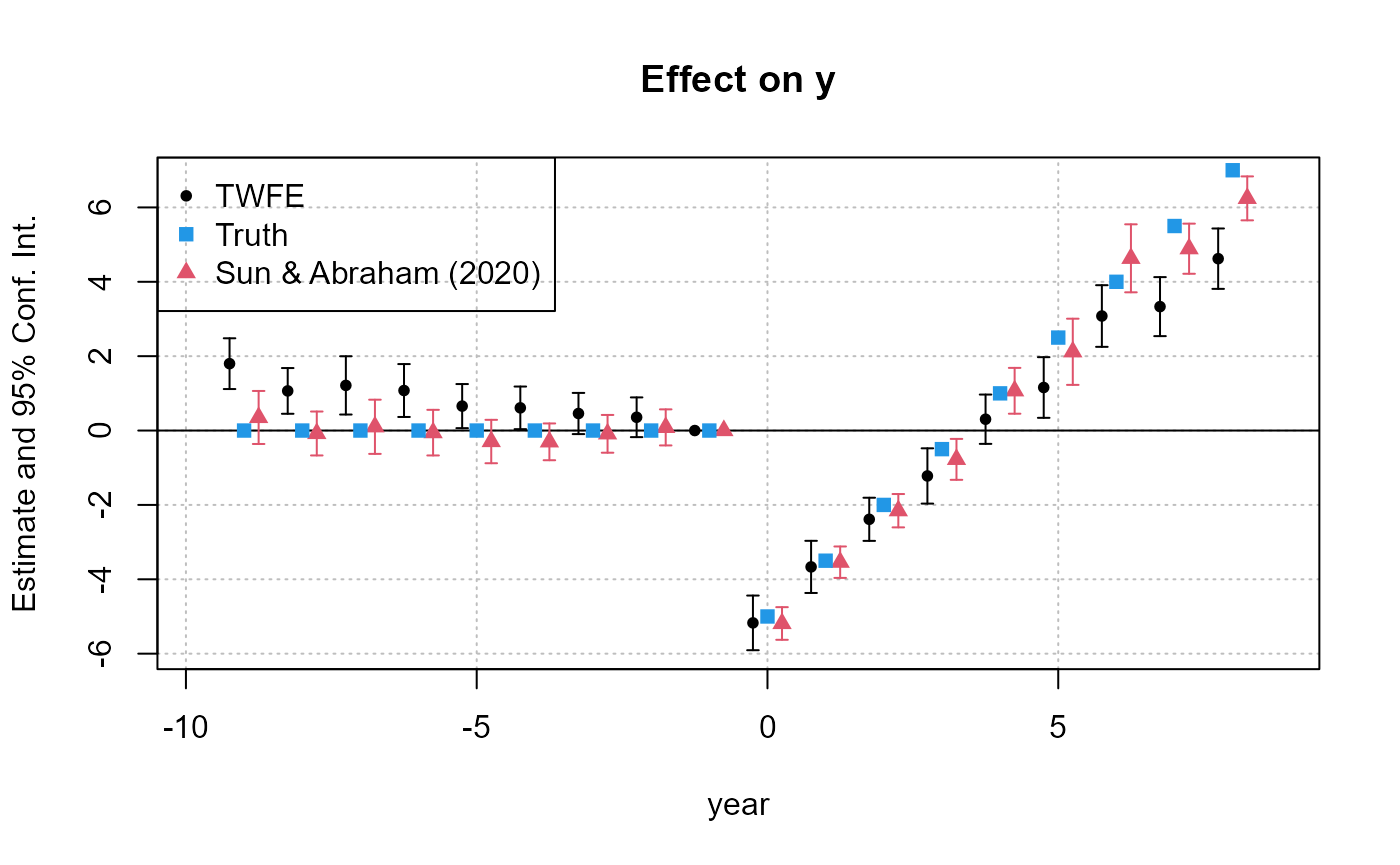
Figures reproduced from the package's official documentation — unofficial community showcase; all credit to the original authors.
Personal recipe — figures are from each package's public docs; this is my own composition, not affiliated with the package authors.
When treatment rolls out at different times, plain TWFE is biased. I run three modern estimators on the same panel and overlay their event studies — if they agree, I trust the dynamics.
Discuss the workflow (0)
Log in to join the discussion.