
Synthetic control, the tidy way — weights, gaps and placebo inference (tidysynth)

@misc{tidysynth,
  title        = {tidysynth},
  author       = {Eric Dunford},
  howpublished = {\url{https://github.com/edunford/tidysynth}},
  note         = {Software / documentation}
}Follow the analysis.
Select a node to explore the method
Panel, treated unit, donor pool
Data preparation — shapes the raw inputs into what the estimator expects.
Pick the treated unit and intervention time; the rest of the units form the donor pool. Identification rests on a good pre-treatment fit.
synthetic_control(outcome = cigsale, unit = state,
                  time = year, i_unit = 'California', i_time = 1988)

Before using this step, make its assumptions and its output explicit. A useful peer note explains what you would check, what could go wrong, or what would change your interpretation.
Questions to explore- Which assumption matters most here, and what evidence could challenge it?
- What would you check before passing this output to the next step?
Choose a question to start your comment.
Peer discussion
- Bring your experience, a question, or a different perspective.
Log in to comment on this step.
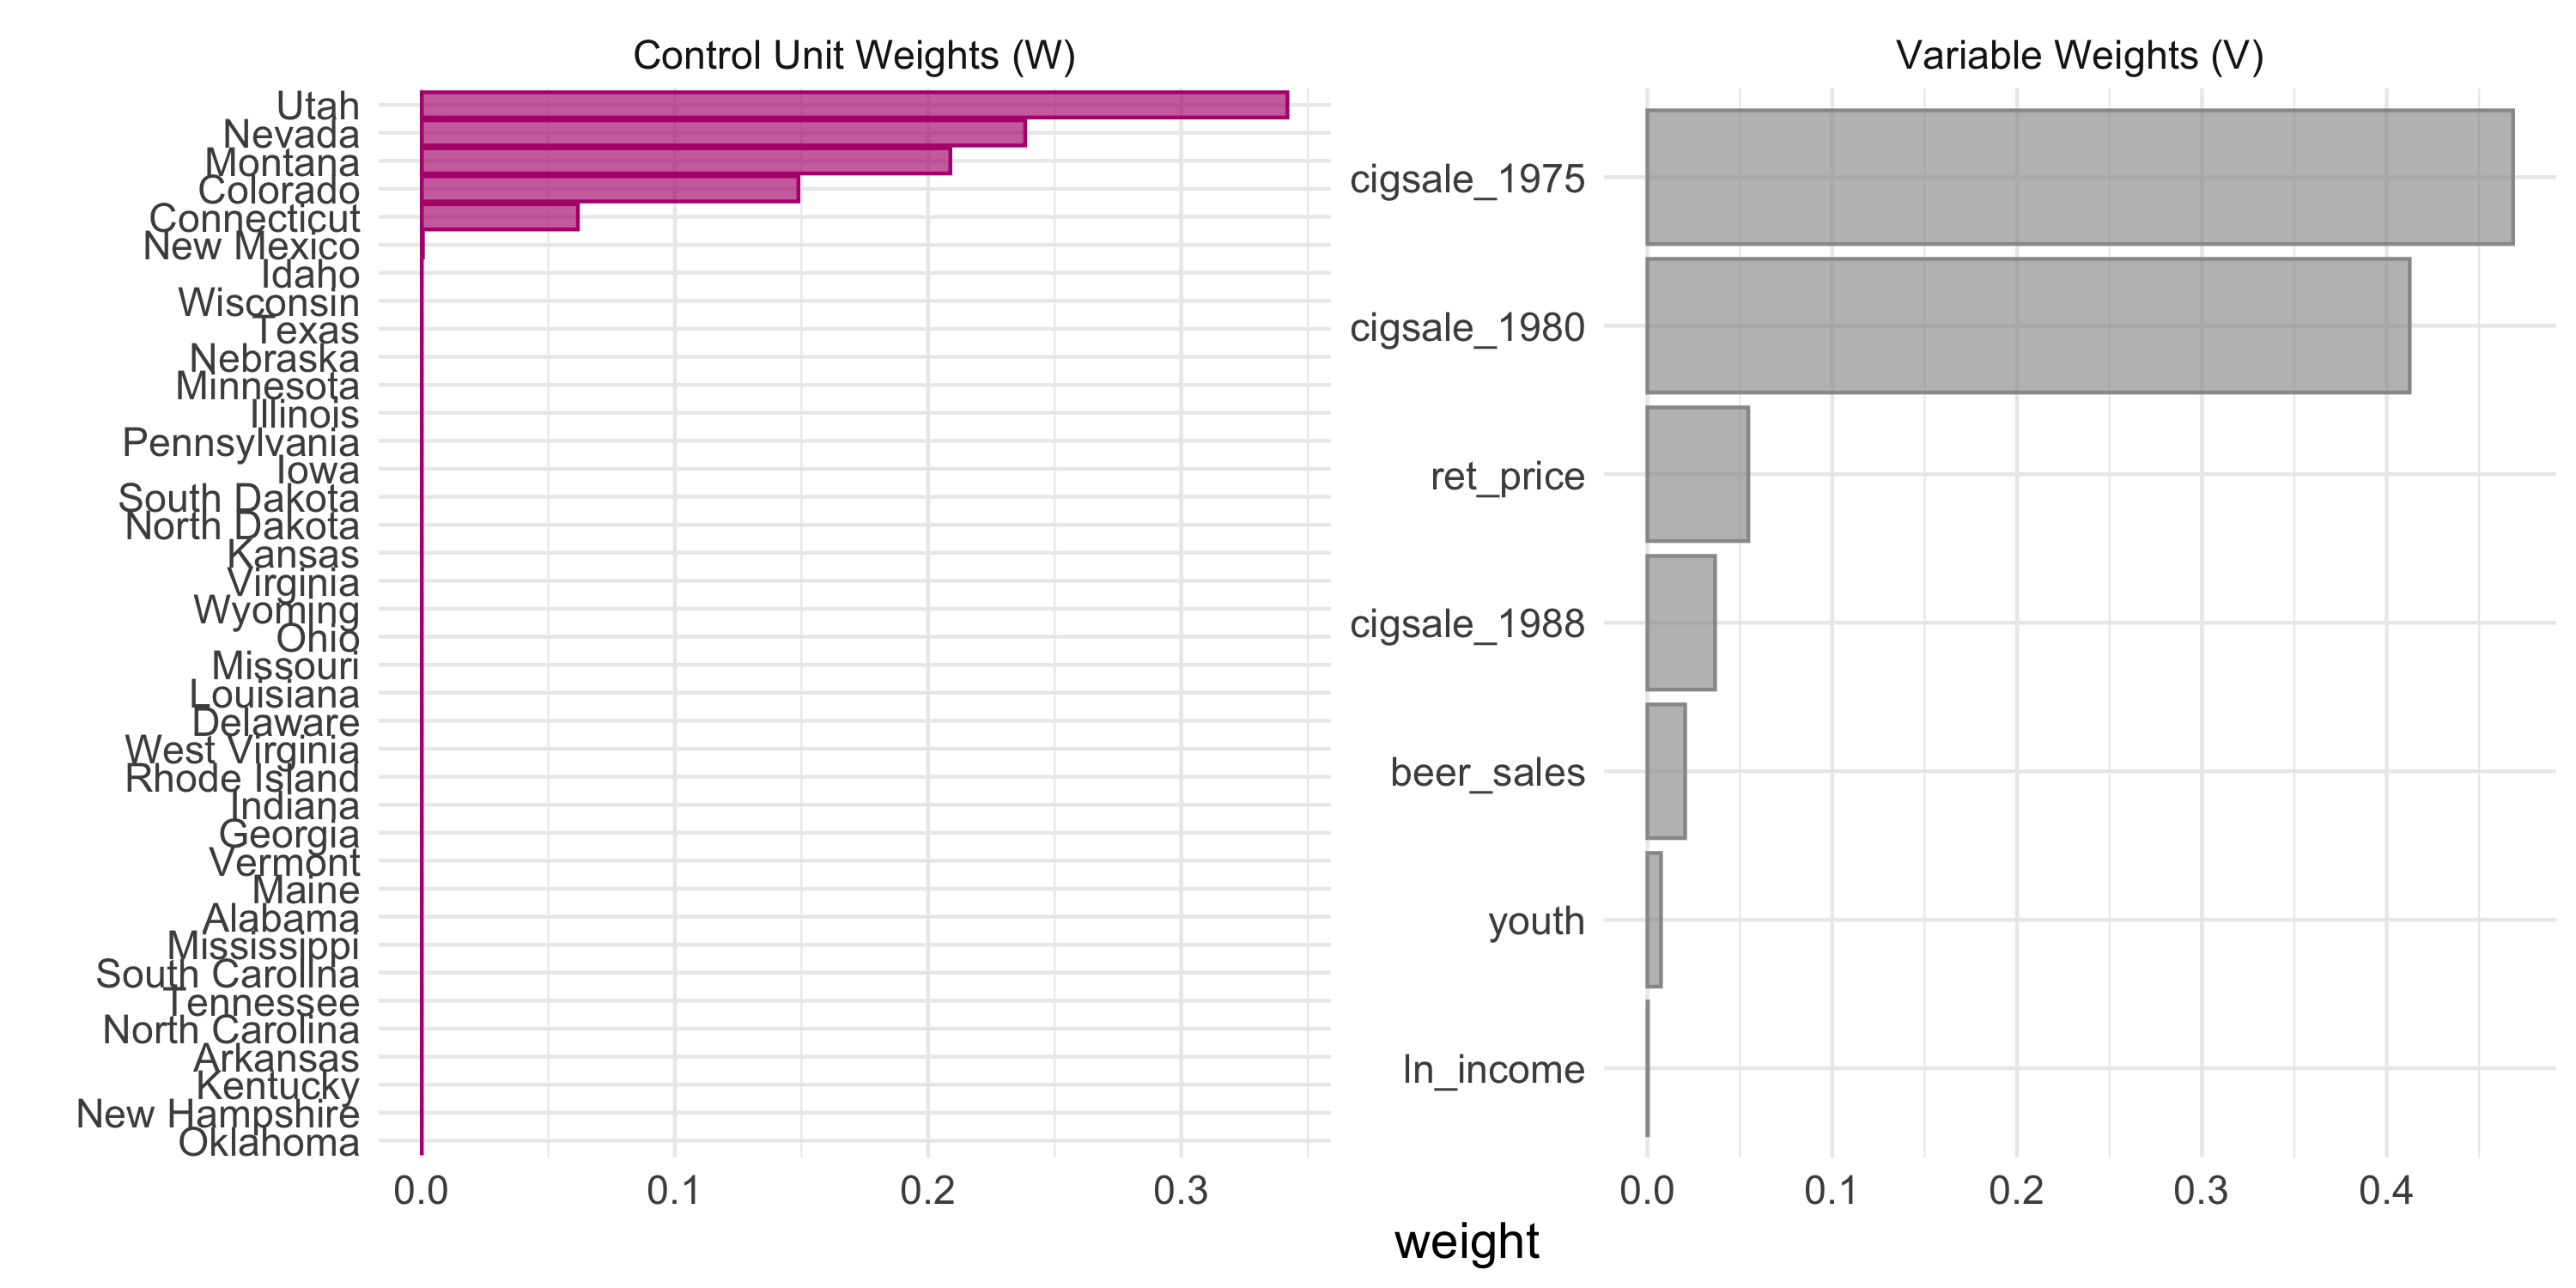
Solve for donor & predictor weights
The core estimate — where the causal quantity itself is computed.
Convex weights make the synthetic unit match the treated unit's pre-period predictors as closely as possible.
generate_weights() %>% generate_control()
Before using this step, make its assumptions and its output explicit. A useful peer note explains what you would check, what could go wrong, or what would change your interpretation.
Questions to explore- Which assumption matters most here, and what evidence could challenge it?
- What would you check before passing this output to the next step?
Choose a question to start your comment.
Peer discussion
- Bring your experience, a question, or a different perspective.
Log in to comment on this step.
Read the gap: observed − synthetic
Reporting — turn the numbers into a figure or table a reader can act on.
The post-treatment gap between the treated unit and its synthetic twin is the estimated effect over time.
plot_trends(out); plot_differences(out)
Before using this step, make its assumptions and its output explicit. A useful peer note explains what you would check, what could go wrong, or what would change your interpretation.
Questions to explore- Which assumption matters most here, and what evidence could challenge it?
- What would you check before passing this output to the next step?
Choose a question to start your comment.
Peer discussion
- Bring your experience, a question, or a different perspective.
Log in to comment on this step.
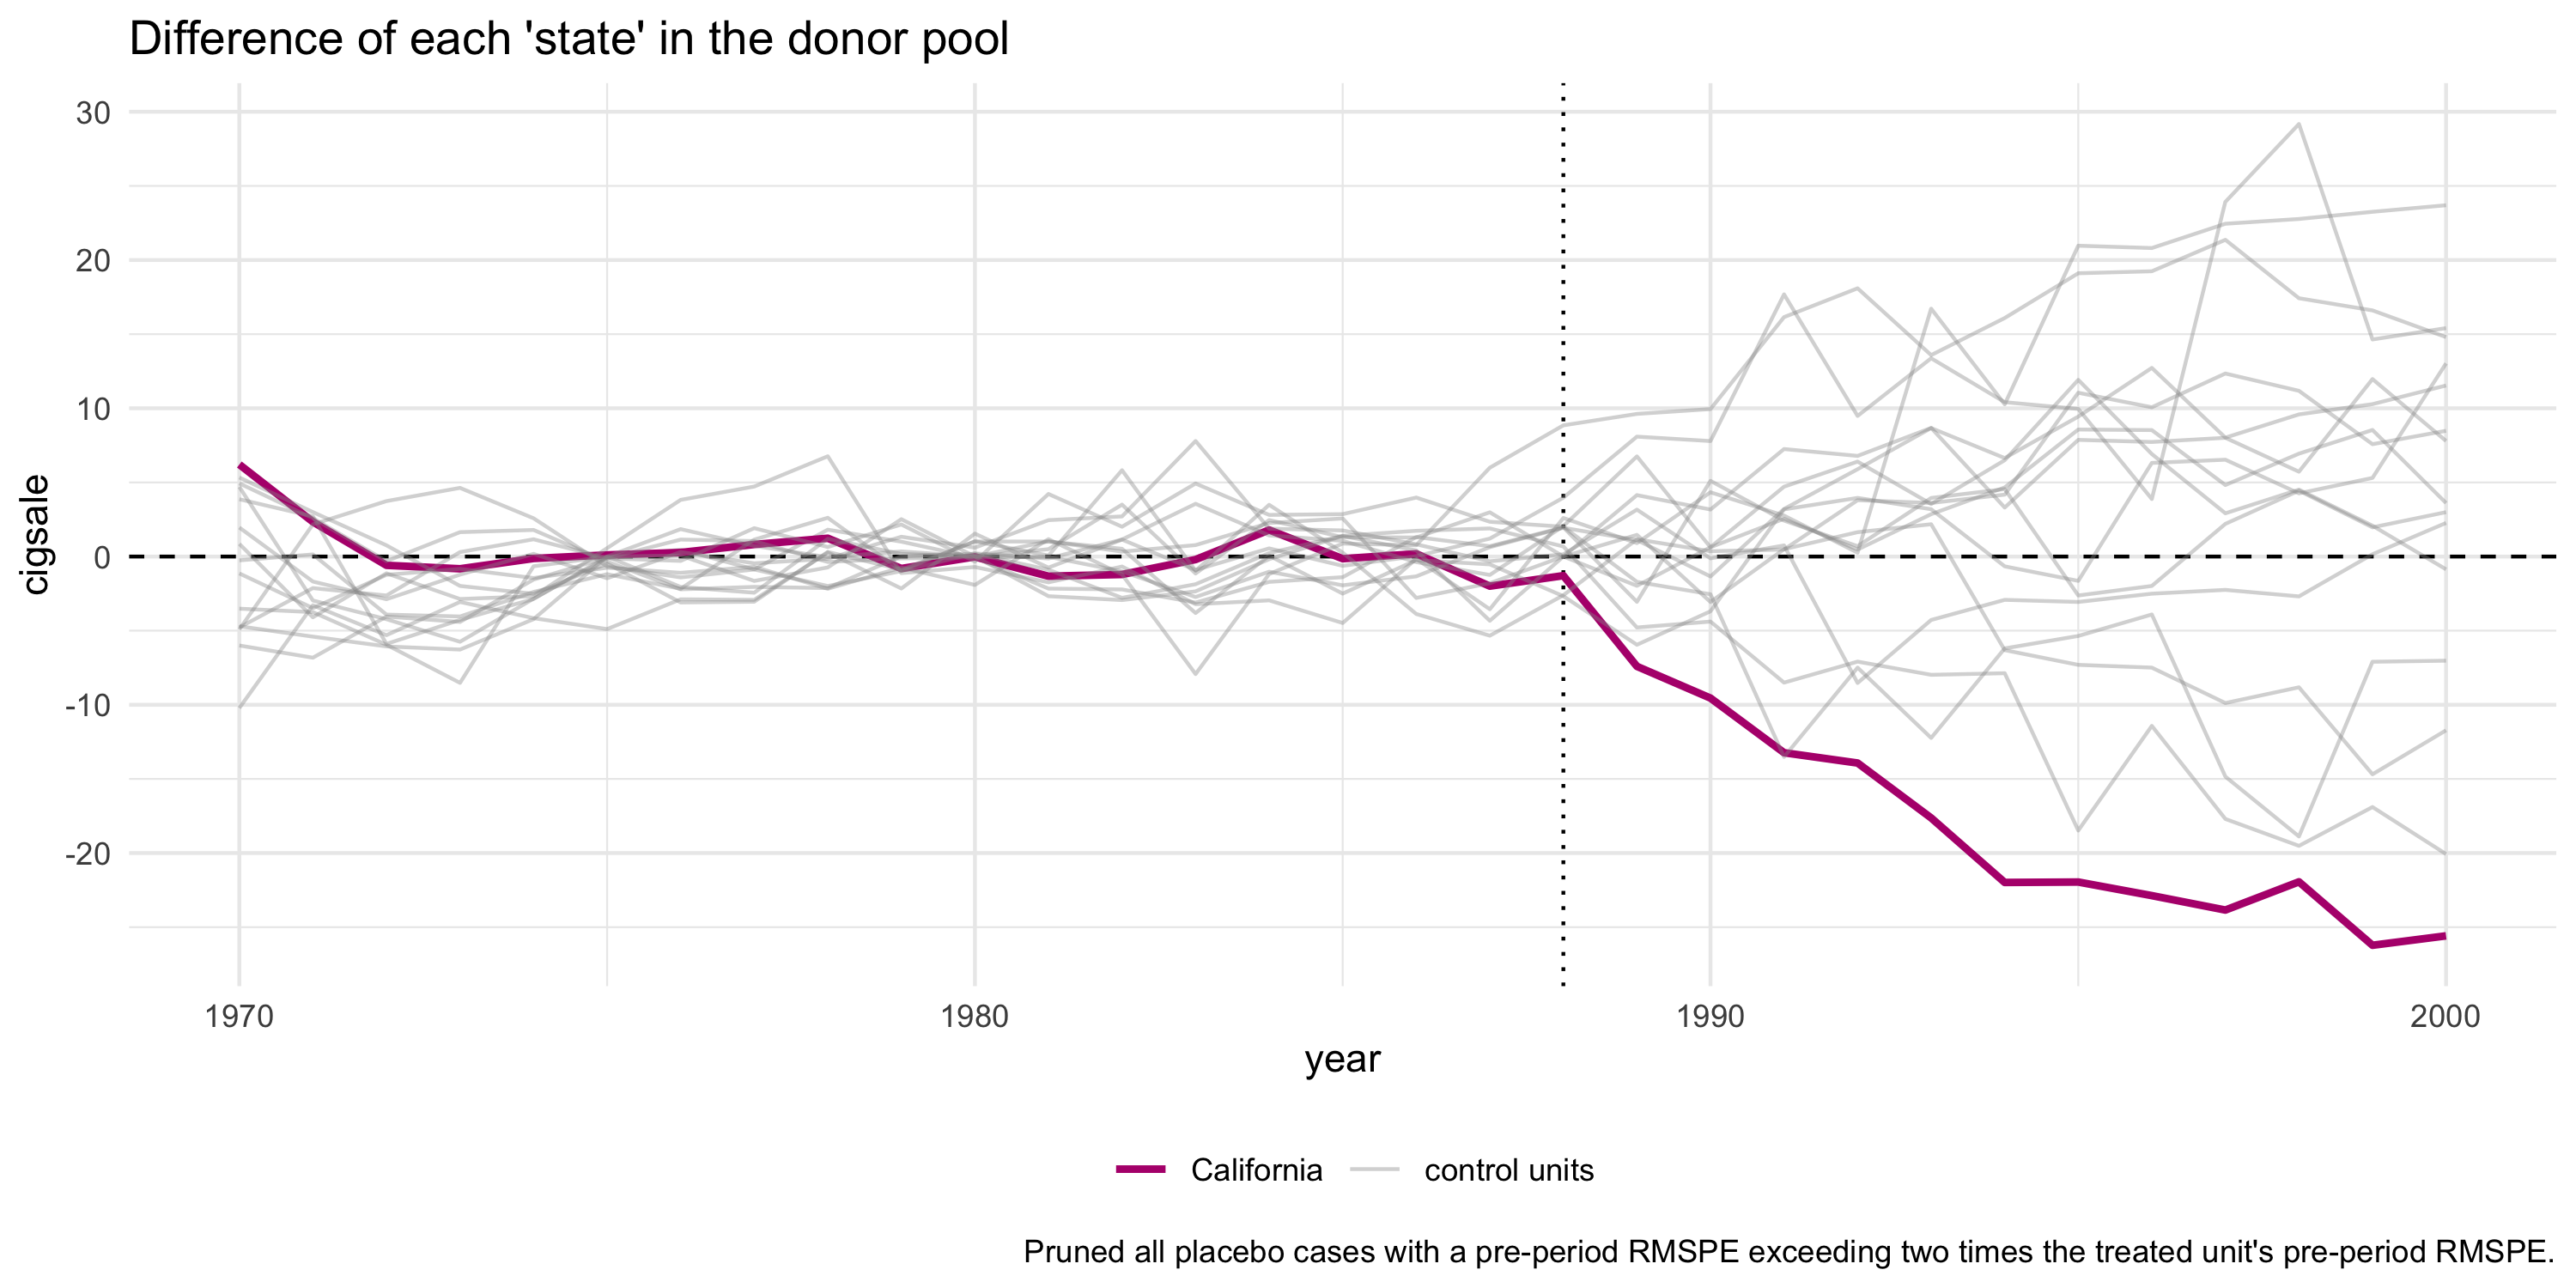
Placebo permutation across donors
Uncertainty quantification — standard errors, intervals, and aggregation.
Re-run the whole procedure pretending each donor was treated; rank the real gap against that placebo distribution via the RMSPE ratio.
plot_placebos(out); plot_mspe_ratio(out)
Before using this step, make its assumptions and its output explicit. A useful peer note explains what you would check, what could go wrong, or what would change your interpretation.
Questions to explore- Which assumption matters most here, and what evidence could challenge it?
- What would you check before passing this output to the next step?
Choose a question to start your comment.
Peer discussion
- Bring your experience, a question, or a different perspective.
Log in to comment on this step.
Inputs & data
A balanced panel (unit × time) with one treated unit switching on at a known time, a donor pool, and a few pre-treatment predictors.
Show data format & exampleHide example
Format — long panel: unit, time, outcome, predictors; one treated unit after T0.
library(tidysynth)
out <- panel %>%
  synthetic_control(outcome = cigsale, unit = state, time = year,
                    i_unit = 'California', i_time = 1988) %>%
  generate_predictor(...) %>% generate_weights() %>% generate_control()
Figures reproduced from tidysynth — Eric Dunford — unofficial community showcase; all credit to the original authors.
⚠️ Unofficial community showcase of tidysynth. Not affiliated with the authors; all credit to them.
Build a synthetic version of the treated unit from a convex blend of donors, read the treated-minus-synthetic gap, and test it against placebos run on every donor.
Discuss the workflow (2)
Log in to join the discussion.
The pipe-friendly API finally makes SC readable end to end. plot_placebos() as the inference step is the part people skip.
Showing the donor and predictor weights side by side is underrated — it's the honest answer to 'where does the counterfactual come from?'.
Agreed. If one donor carries 0.8 of the weight, the 'synthetic' control is basically that one unit and you should say so.